- Write a RESTful API with Ballerina
- Write a gRPC service with Ballerina
- Write a GraphQL API with Ballerina
- Work with data using queries in Ballerina
- Build a data service in Ballerina
- Build a Change Data Capture (CDC) service in Ballerina
- Work with Large Language Models (LLMs) using natural expressions
- Deploy Ballerina on Kubernetes
- Manage data persistence with bal persist
- Create your first connector with Ballerina
Users can observe Ballerina programs with OpenSearch, which is a community-driven, Apache 2.0-licensed open-source search and analytics suite that makes it easy to ingest, search, visualize, and analyze data. It provides a highly scalable system for providing fast access and response to large volumes of data with an integrated visualization tool, OpenSearch Dashboards, that makes it easy for users to explore their data.
The sample shop service will be used in this guide.
Follow the steps given below to view Ballerina metrics, traces and logs in OpenSearch.
Step 1 - Set up OpenSearch
This section focuses on configuring OpenSearch with Docker as a quick installation.
-
Download and unzip the opensearch-observability-dashboard.zip in your local machine.
The
opensearch-observability-dashboarddirectory structure should look like this:├── config │ ├── dashboards │ │ └── opensearch_dashboards.yml │ ├── data-prepper │ │ └── pipelines.yaml │ ├── fluent-bit │ │ ├── fluent-bit.conf │ │ ├── parsers.conf │ │ └── scripts │ │ └── scripts.lua │ └── .env ├── logs │ └── ballerina ├── setup │ ├── opensearch-dashboards-template.ndjson │ └── index-template-request.json └── docker-compose.yml -
Update
OPENSEARCH_INITIAL_ADMIN_PASSWORDin thepath/to/opensearch-observability-dashboard/config/.envfile.OPENSEARCH_INITIAL_ADMIN_PASSWORD=<PASSWORD> # Password for the OpenSearch admin userThis password will be used to access the OpenSearch server.
-
Navigate to the
path/to/opensearch-observability-dashboarddirectory and rundocker composeto start the OpenSearch server.docker compose -f docker-compose.yml up -d
Step 2 - Set up Ballerina application for observability
-
Open the
main.balfile in the Ballerina package and add the following imports.import ballerinax/metrics.logs as _; import ballerinax/jaeger as _; -
Create the
Config.tomlfile in the package directory to set the runtime configurations as follows.[ballerina.observe] metricsLogsEnabled = true tracingEnabled = true tracingProvider = "jaeger" [ballerinax.jaeger] agentHostname = "localhost" agentPort = 4317 samplerType = "const" samplerParam = 1.0 reporterFlushInterval = 2000 reporterBufferSize = 1000 [ballerinax.metrics.logs] logFilePath = "<PATH>/<TO>/opensearch-observability-dashboard/logs/ballerina/<NAME_FOR_SERVICE>/app.log"Update the
logFilePathwith the path to openSearch observability dashboard logs directory, which ispath/to/opensearch-observability-dashboard/logs/ballerina/<NAME_FOR_SERVICE>/app.log.These configurations enable metrics, logs, and traces in the Ballerina application and configure the Jaeger exporter.
The table below provides the descriptions of each configuration option and possible values that can be assigned.
Configuration key Description Default value Possible values ballerinax.jaeger. agentHostname Hostname of the Jaeger agent localhost IP or hostname of the Jaeger agent. Can be localhost if running on same node as Ballerina. ballerinax.jaeger. agentPort Port of the Jaeger agent 4317 The port on which the Jaeger agent is listening. ballerinax.jaeger. samplerType Type of sampling methods used in Jaeger tracer const const,probabilistic, orratelimitingballerinax.jaeger. samplerParam Floating value parameter for sampler 1.0 const: 0(no sampling) or1(sample all)
probabilistic:0.0to1.0
ratelimiting: positive integer (rate/sec)ballerinax.jaeger. reporterFlushInterval Interval for sending spans to agent 2000 Any positive integer value ballerinax.jaeger. reporterBufferSize Queue size of Jaeger client 1000 Any positive integer value ballerinax.metrics.logs. logFilePath Path to application log file nonePATH/TO/opensearch-observability-dashboard/logs/ballerina/<SERVICE_NAME>/app.log
Step 3 - Run the Ballerina service
When Ballerina observability is enabled, the Ballerina runtime collects metrics, logs, and traces.
Run the following command to start the Ballerina service.
$ bal run Compiling source Running executable ballerina: started publishing traces to Jaeger on localhost:4317
Step 4 - Send requests
Send requests to http://localhost:8090/shop.
Example cURL commands:
$ curl -X GET http://localhost:8090/shop/products
$ curl -X POST http://localhost:8090/shop/product \ -H "Content-Type: application/json" \ -d '{ "id": 4, "name": "Laptop Charger", "price": 50.00 }'
$ curl -X POST http://localhost:8090/shop/order \ -H "Content-Type: application/json" \ -d '{ "productId": 1, "quantity": 1 }'
$ curl -X GET http://localhost:8090/shop/order/0
Step 5 - View distributed tracing on OpenSearch dashboard
Open the OpenSearch Dashboard in your browser at http://localhost:5601 and log in using the admin credentials you set up in the .env file.
Use the username admin and the password you set for OPENSEARCH_INITIAL_ADMIN_PASSWORD.
Navigate to the Traces tab under Observability section.
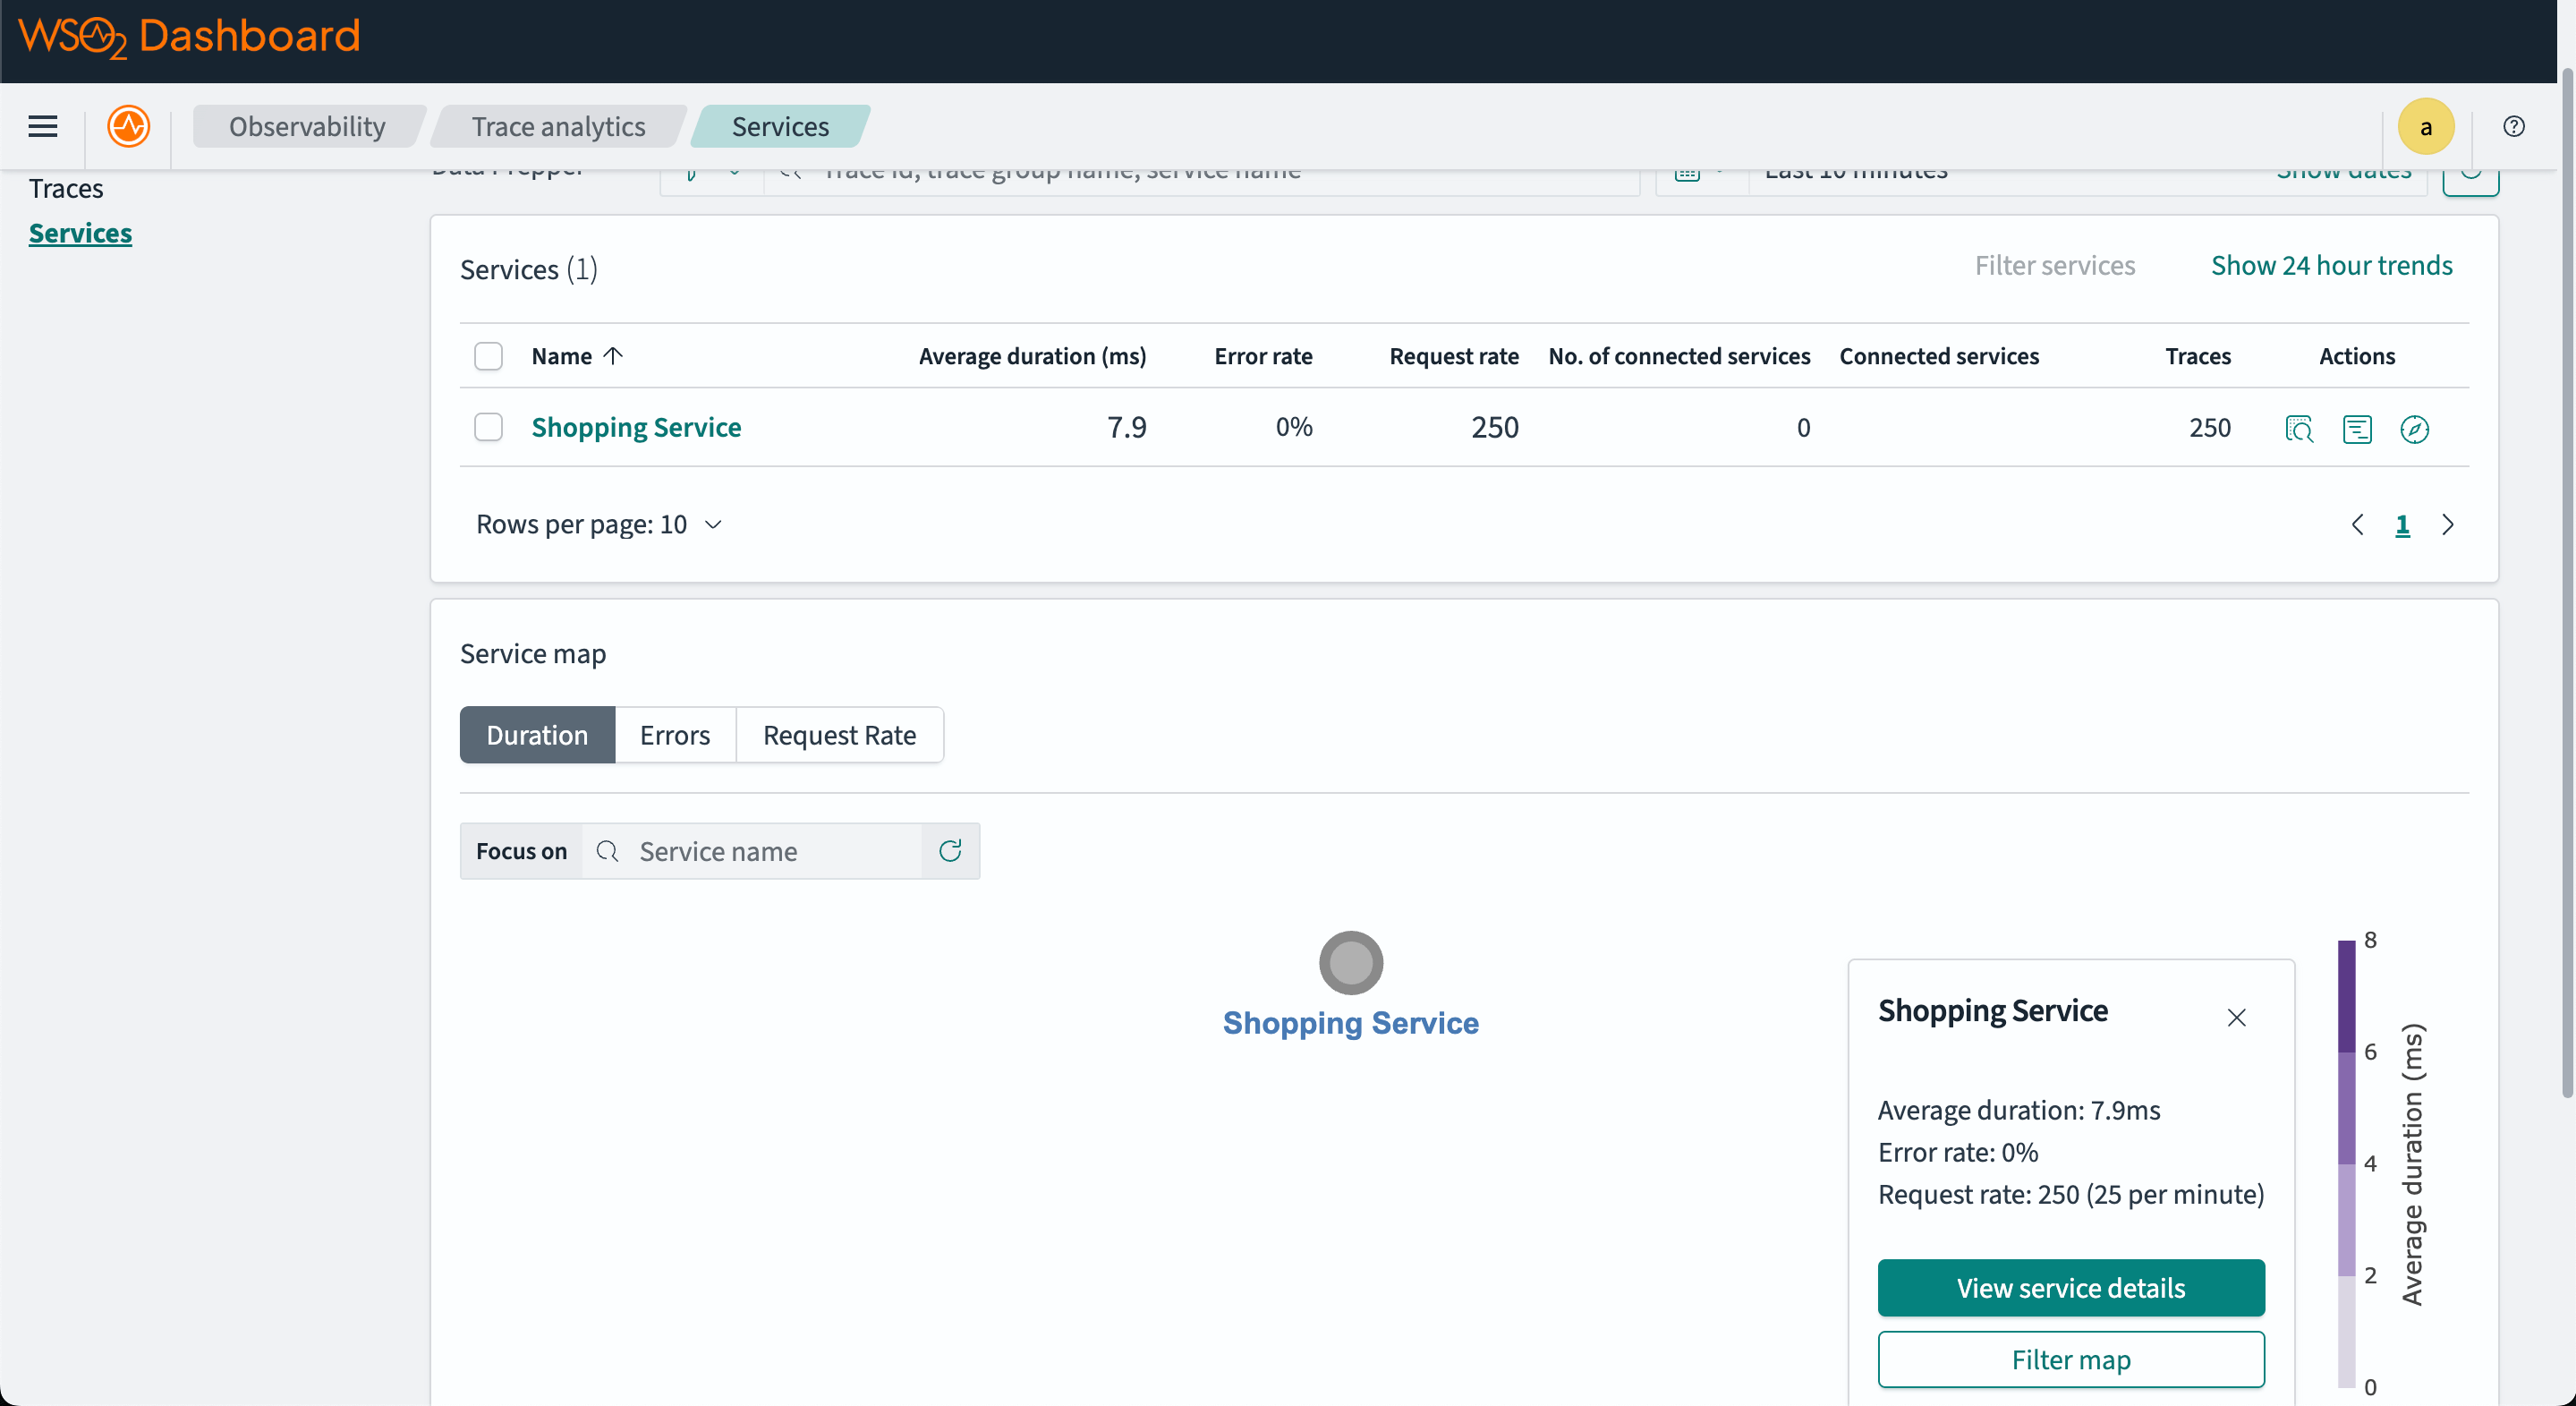
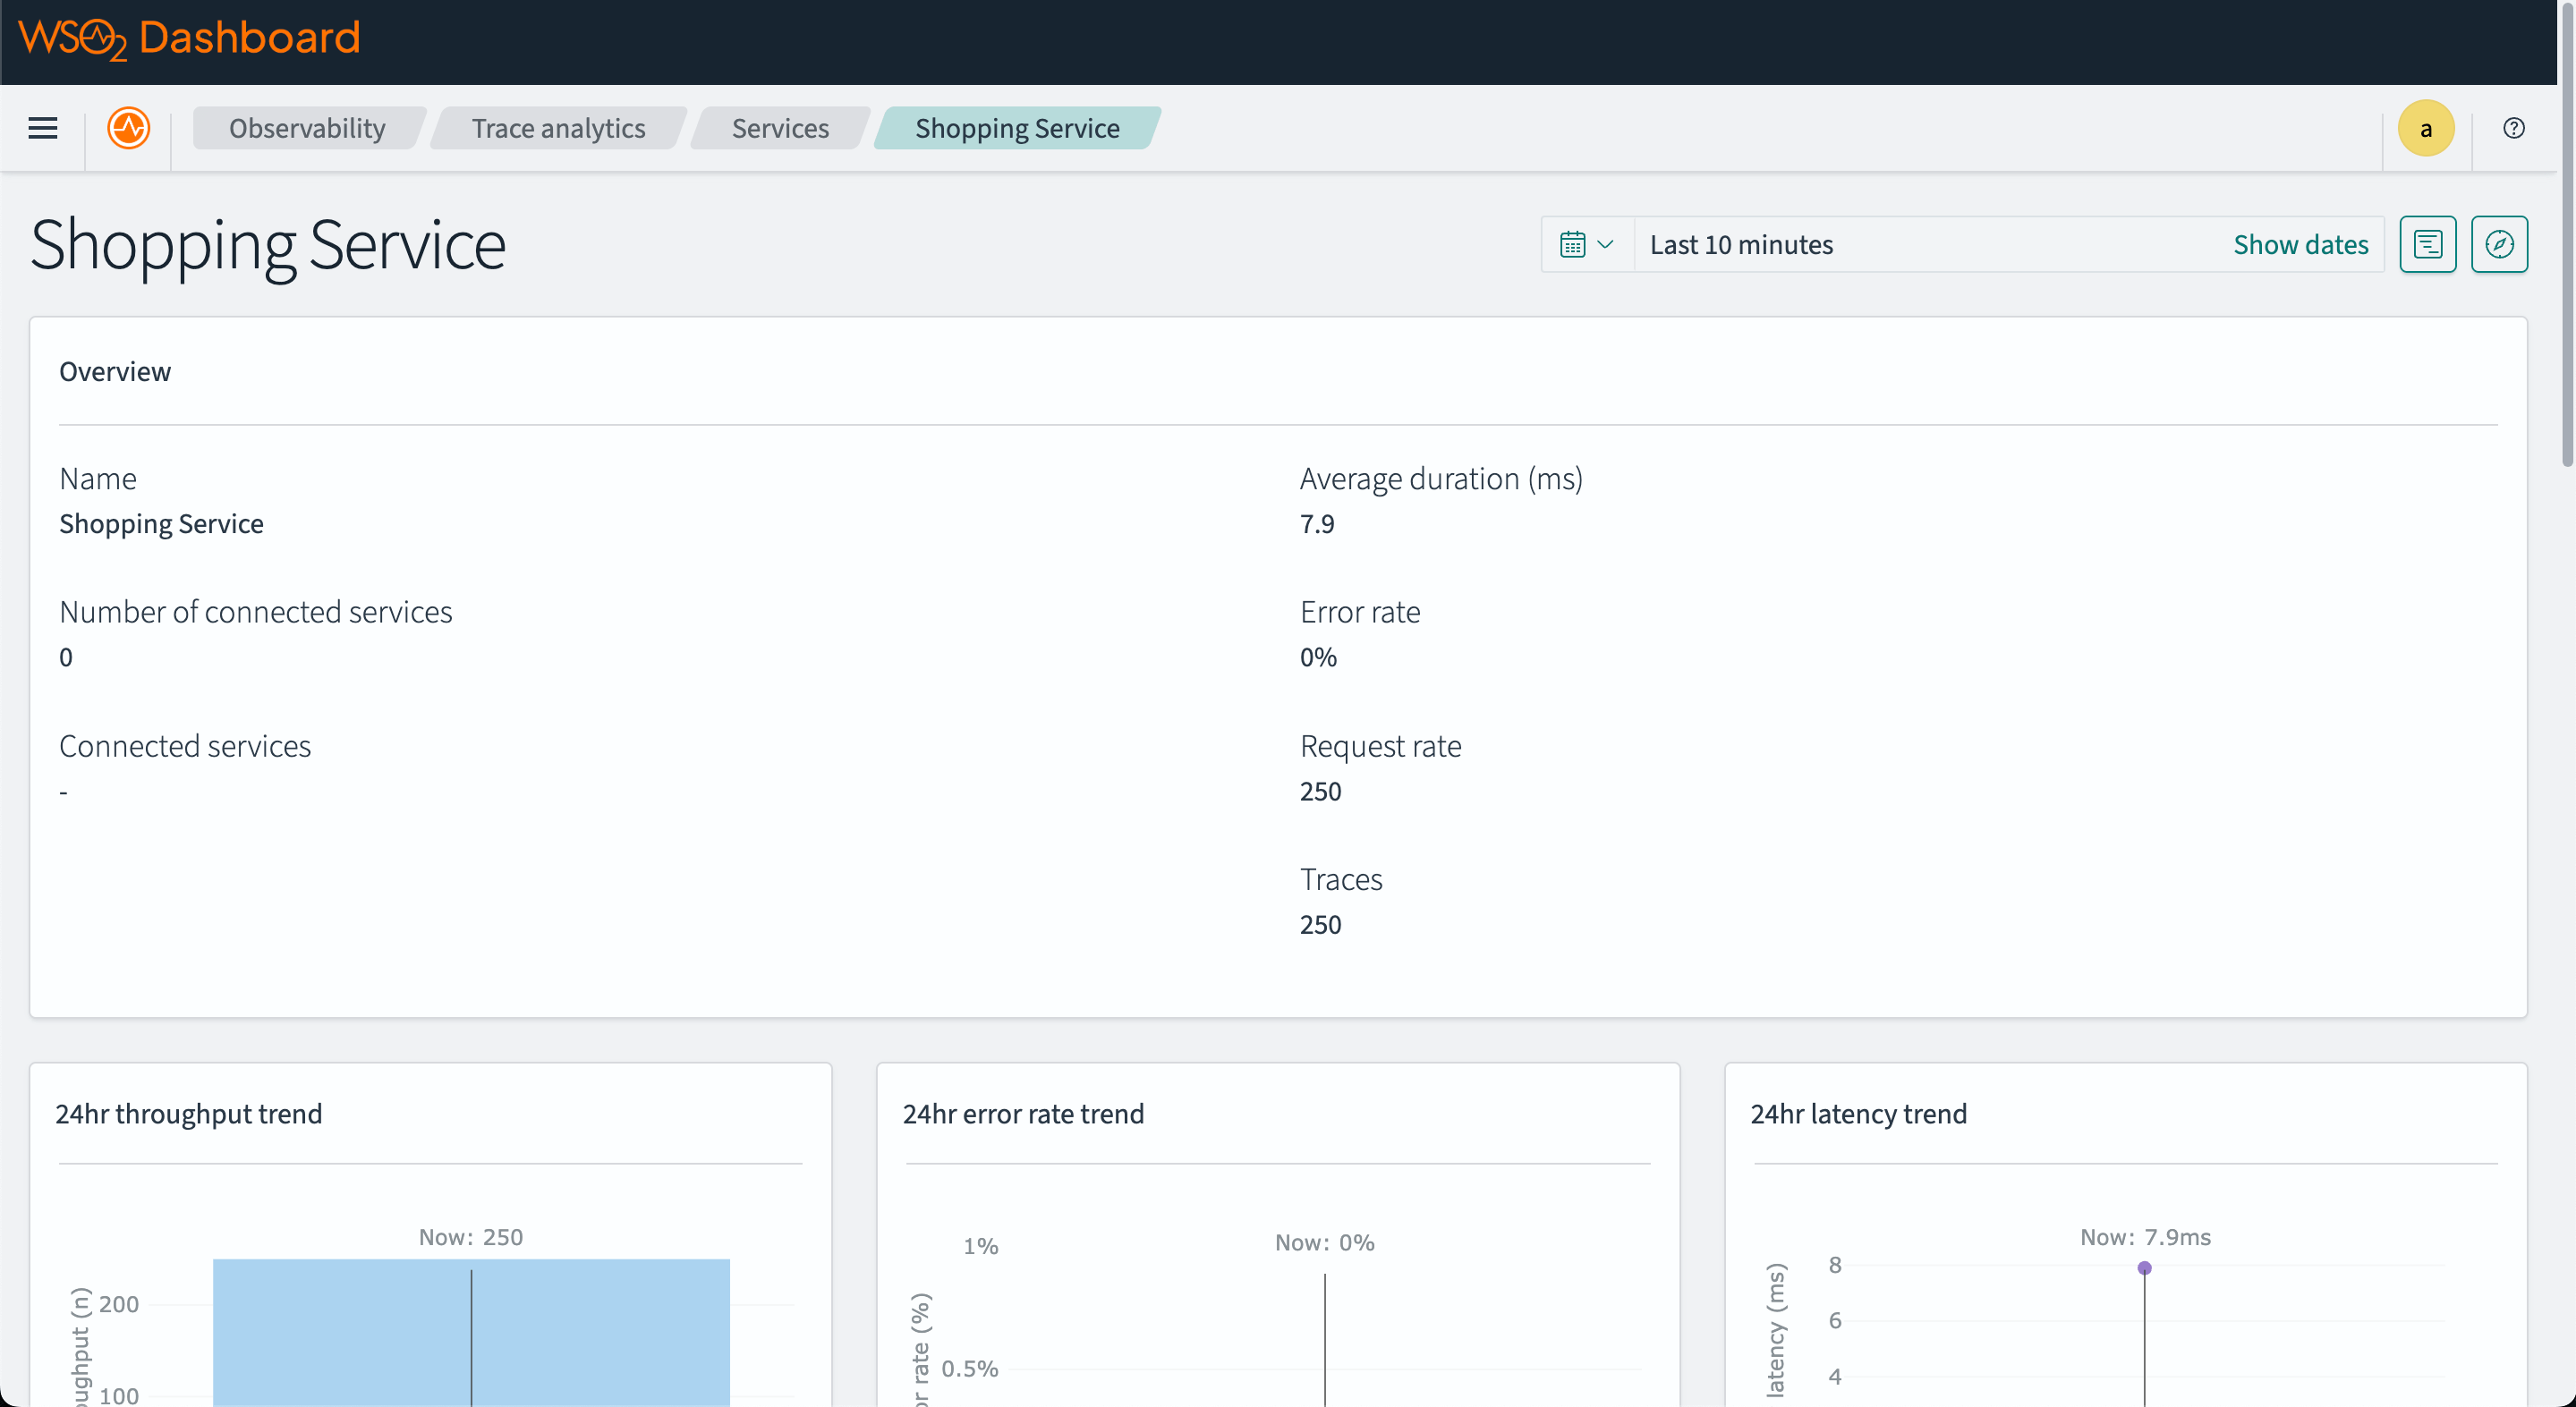
The image below is a sample tracing information you can see in OpenSearch.
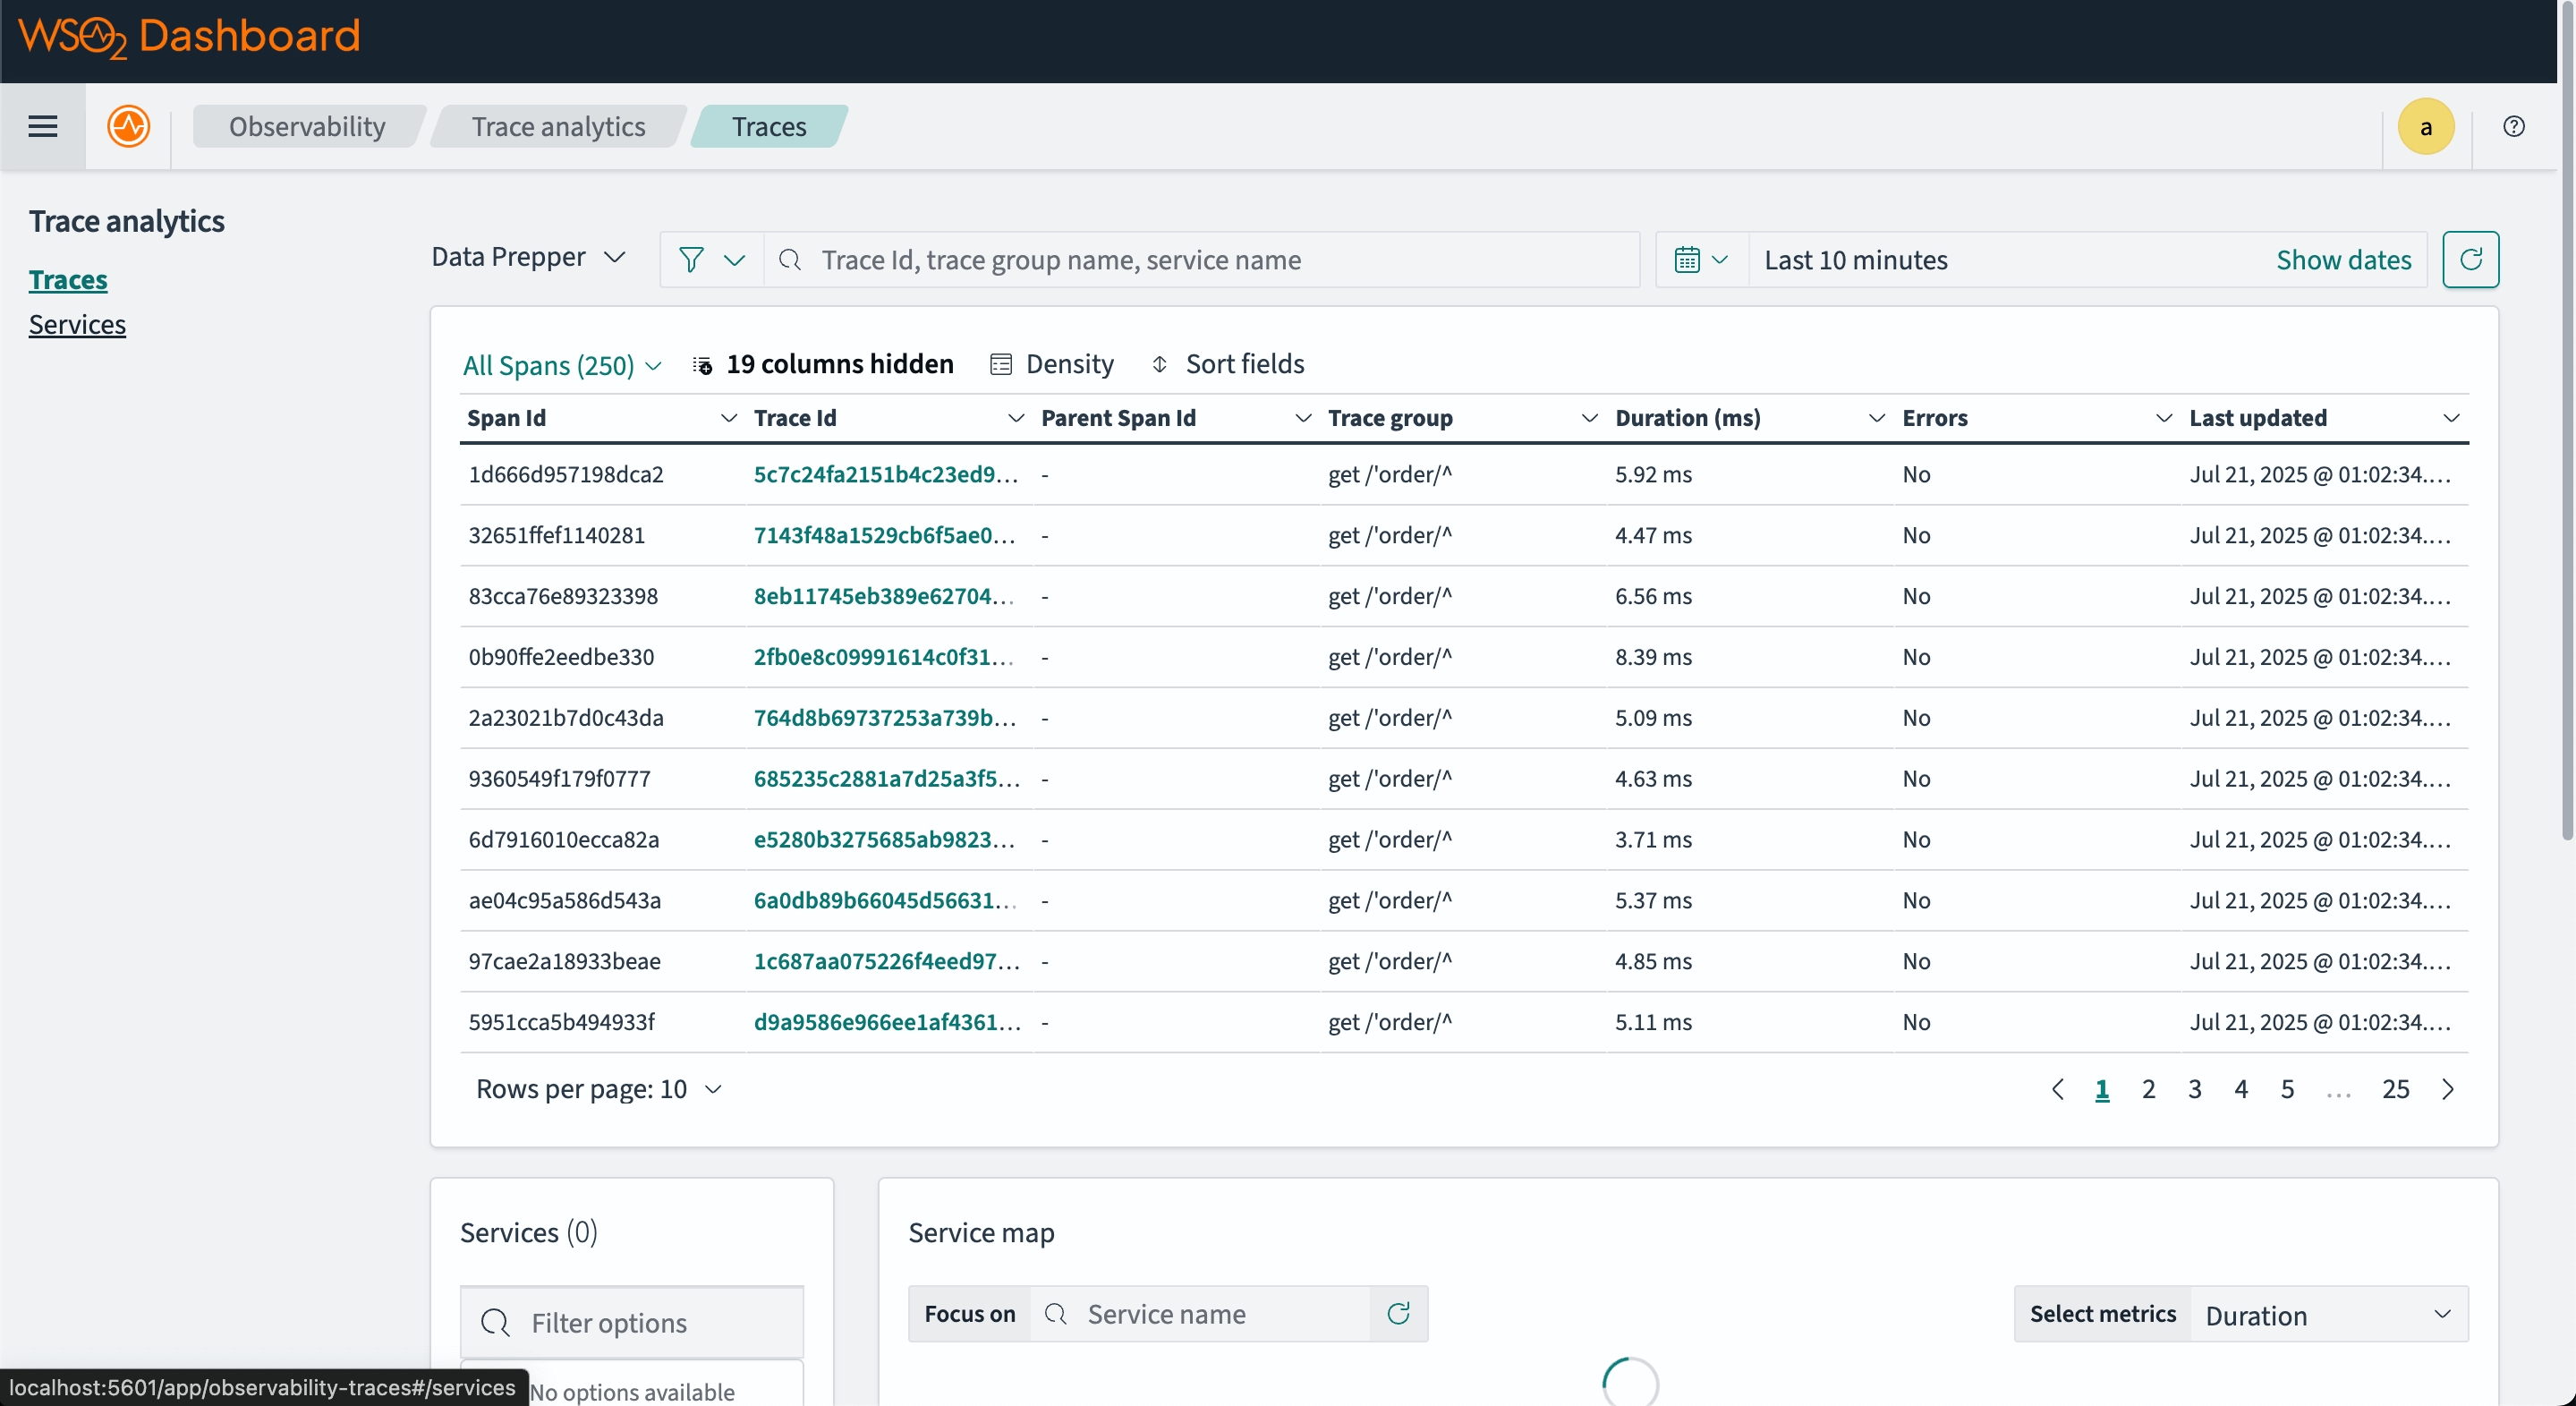
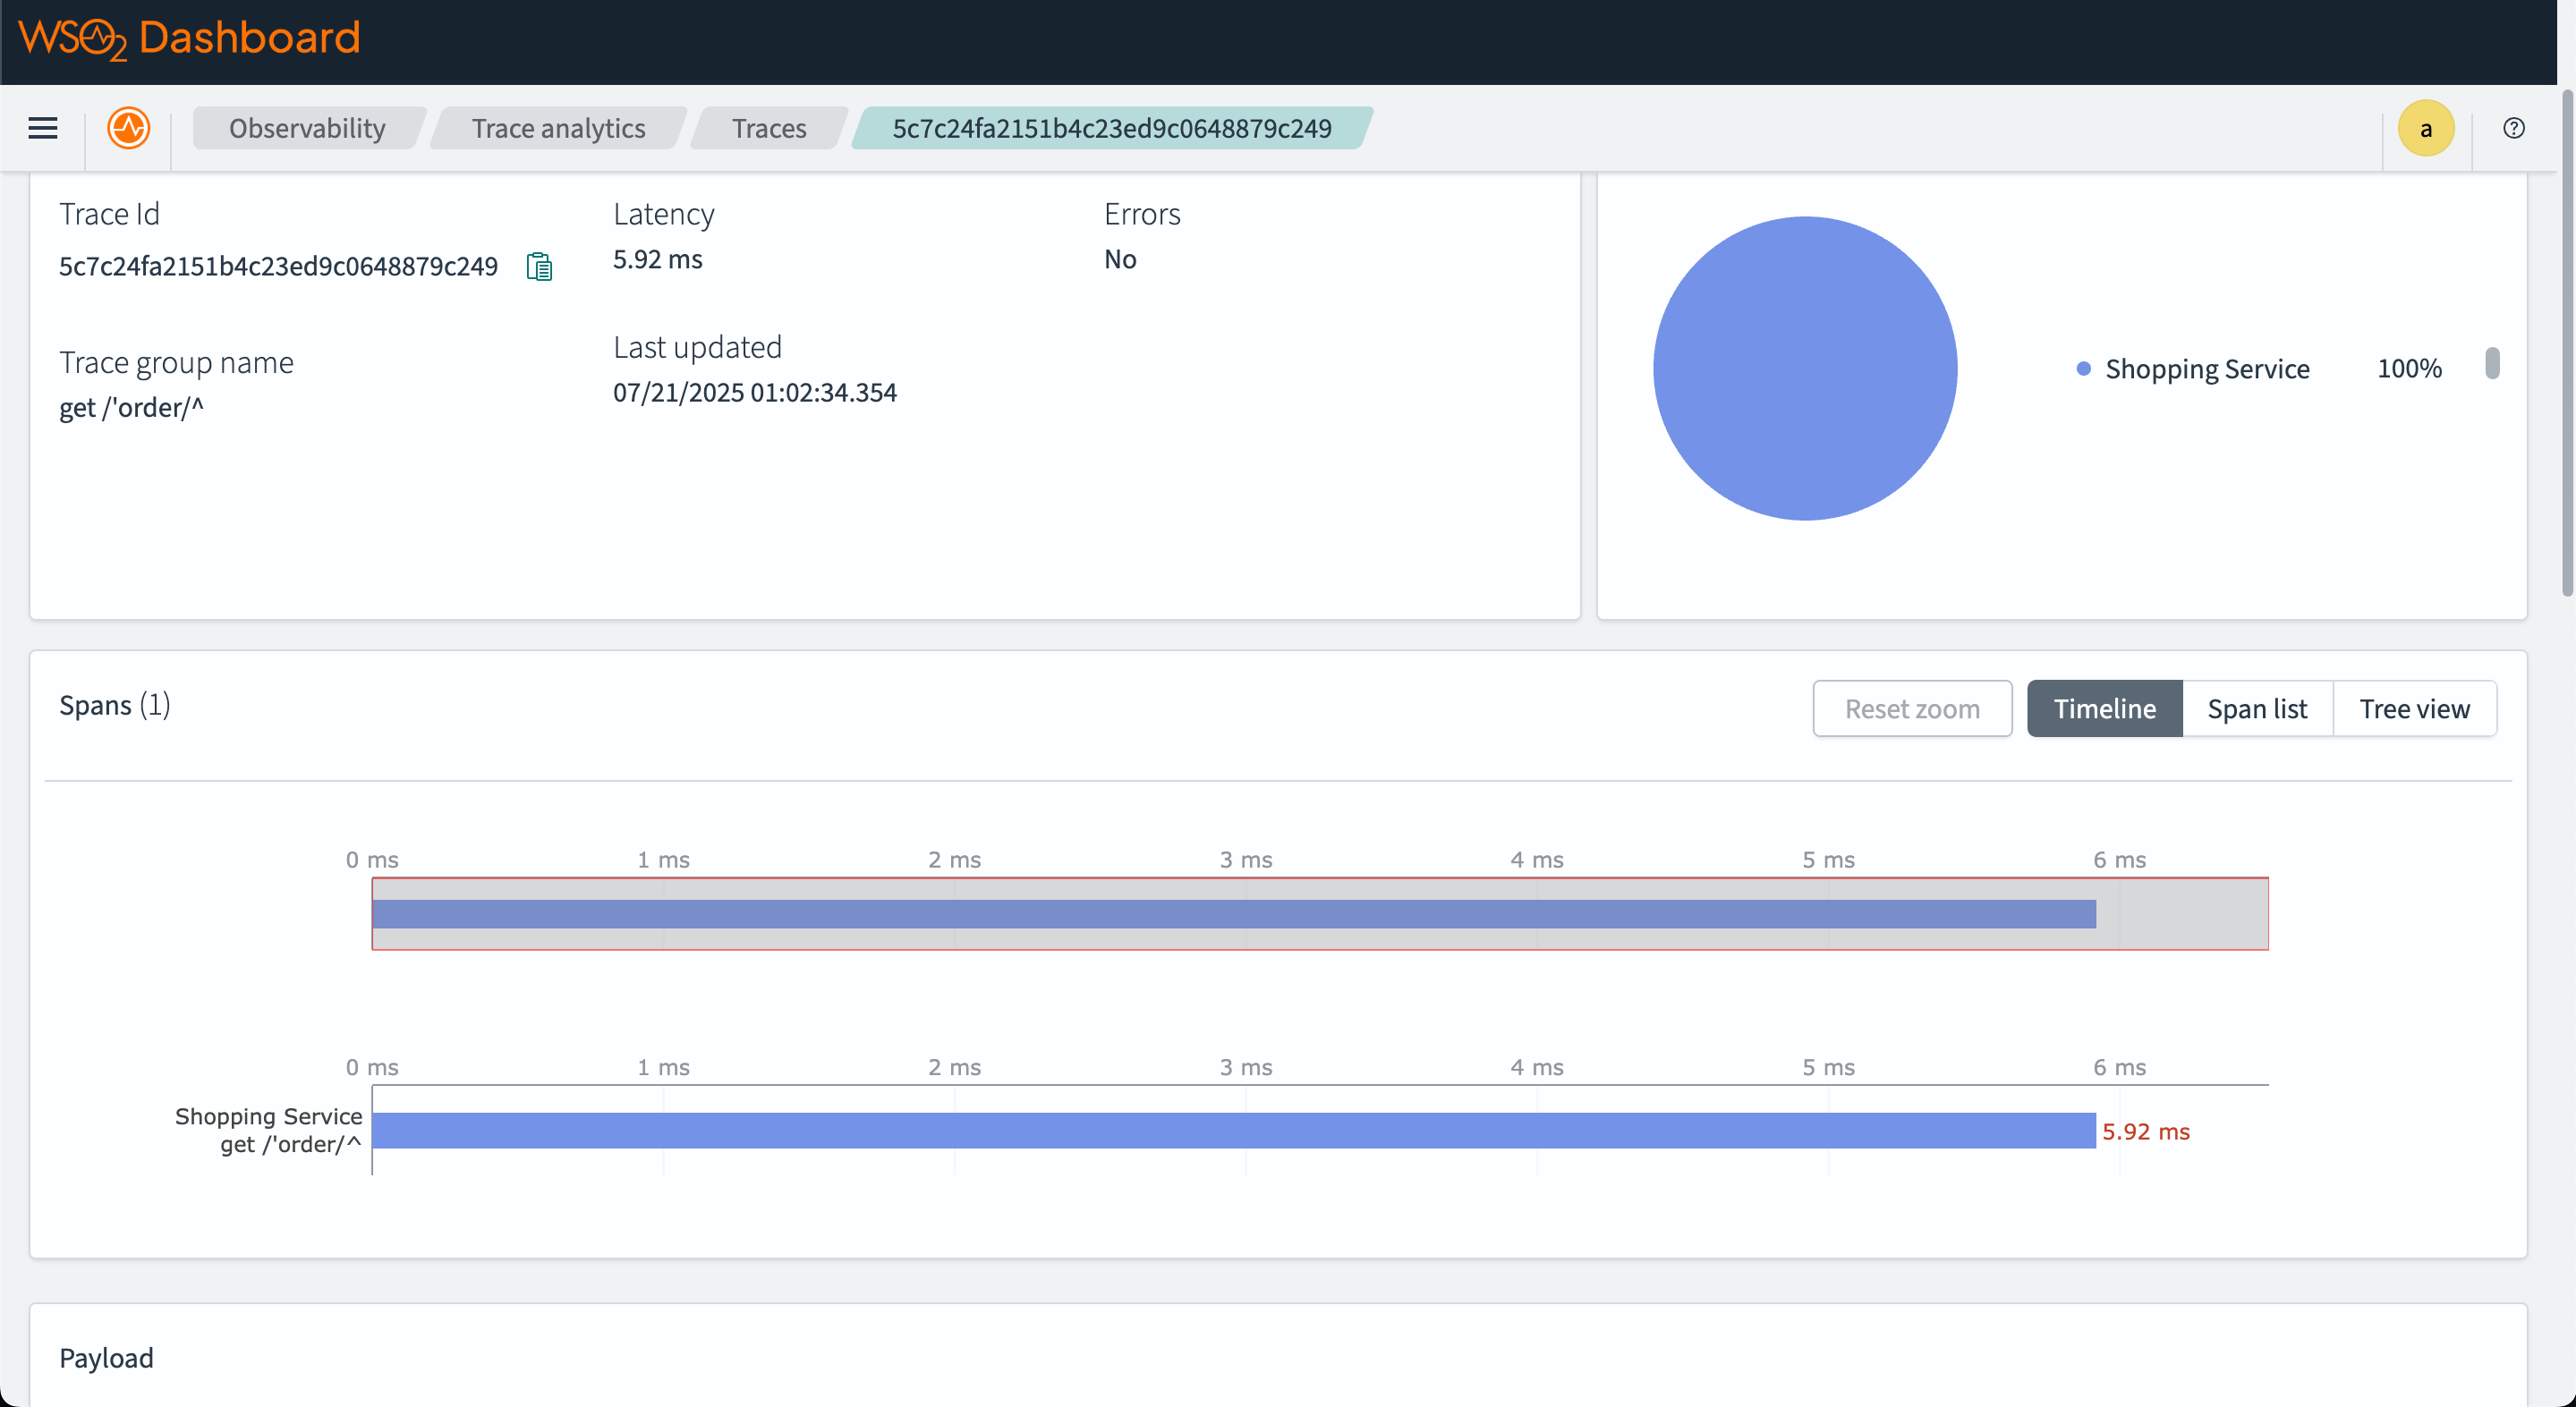
The service map shows the relationship between different services in the system.
Step 6 - View metrics on OpenSearch dashboard
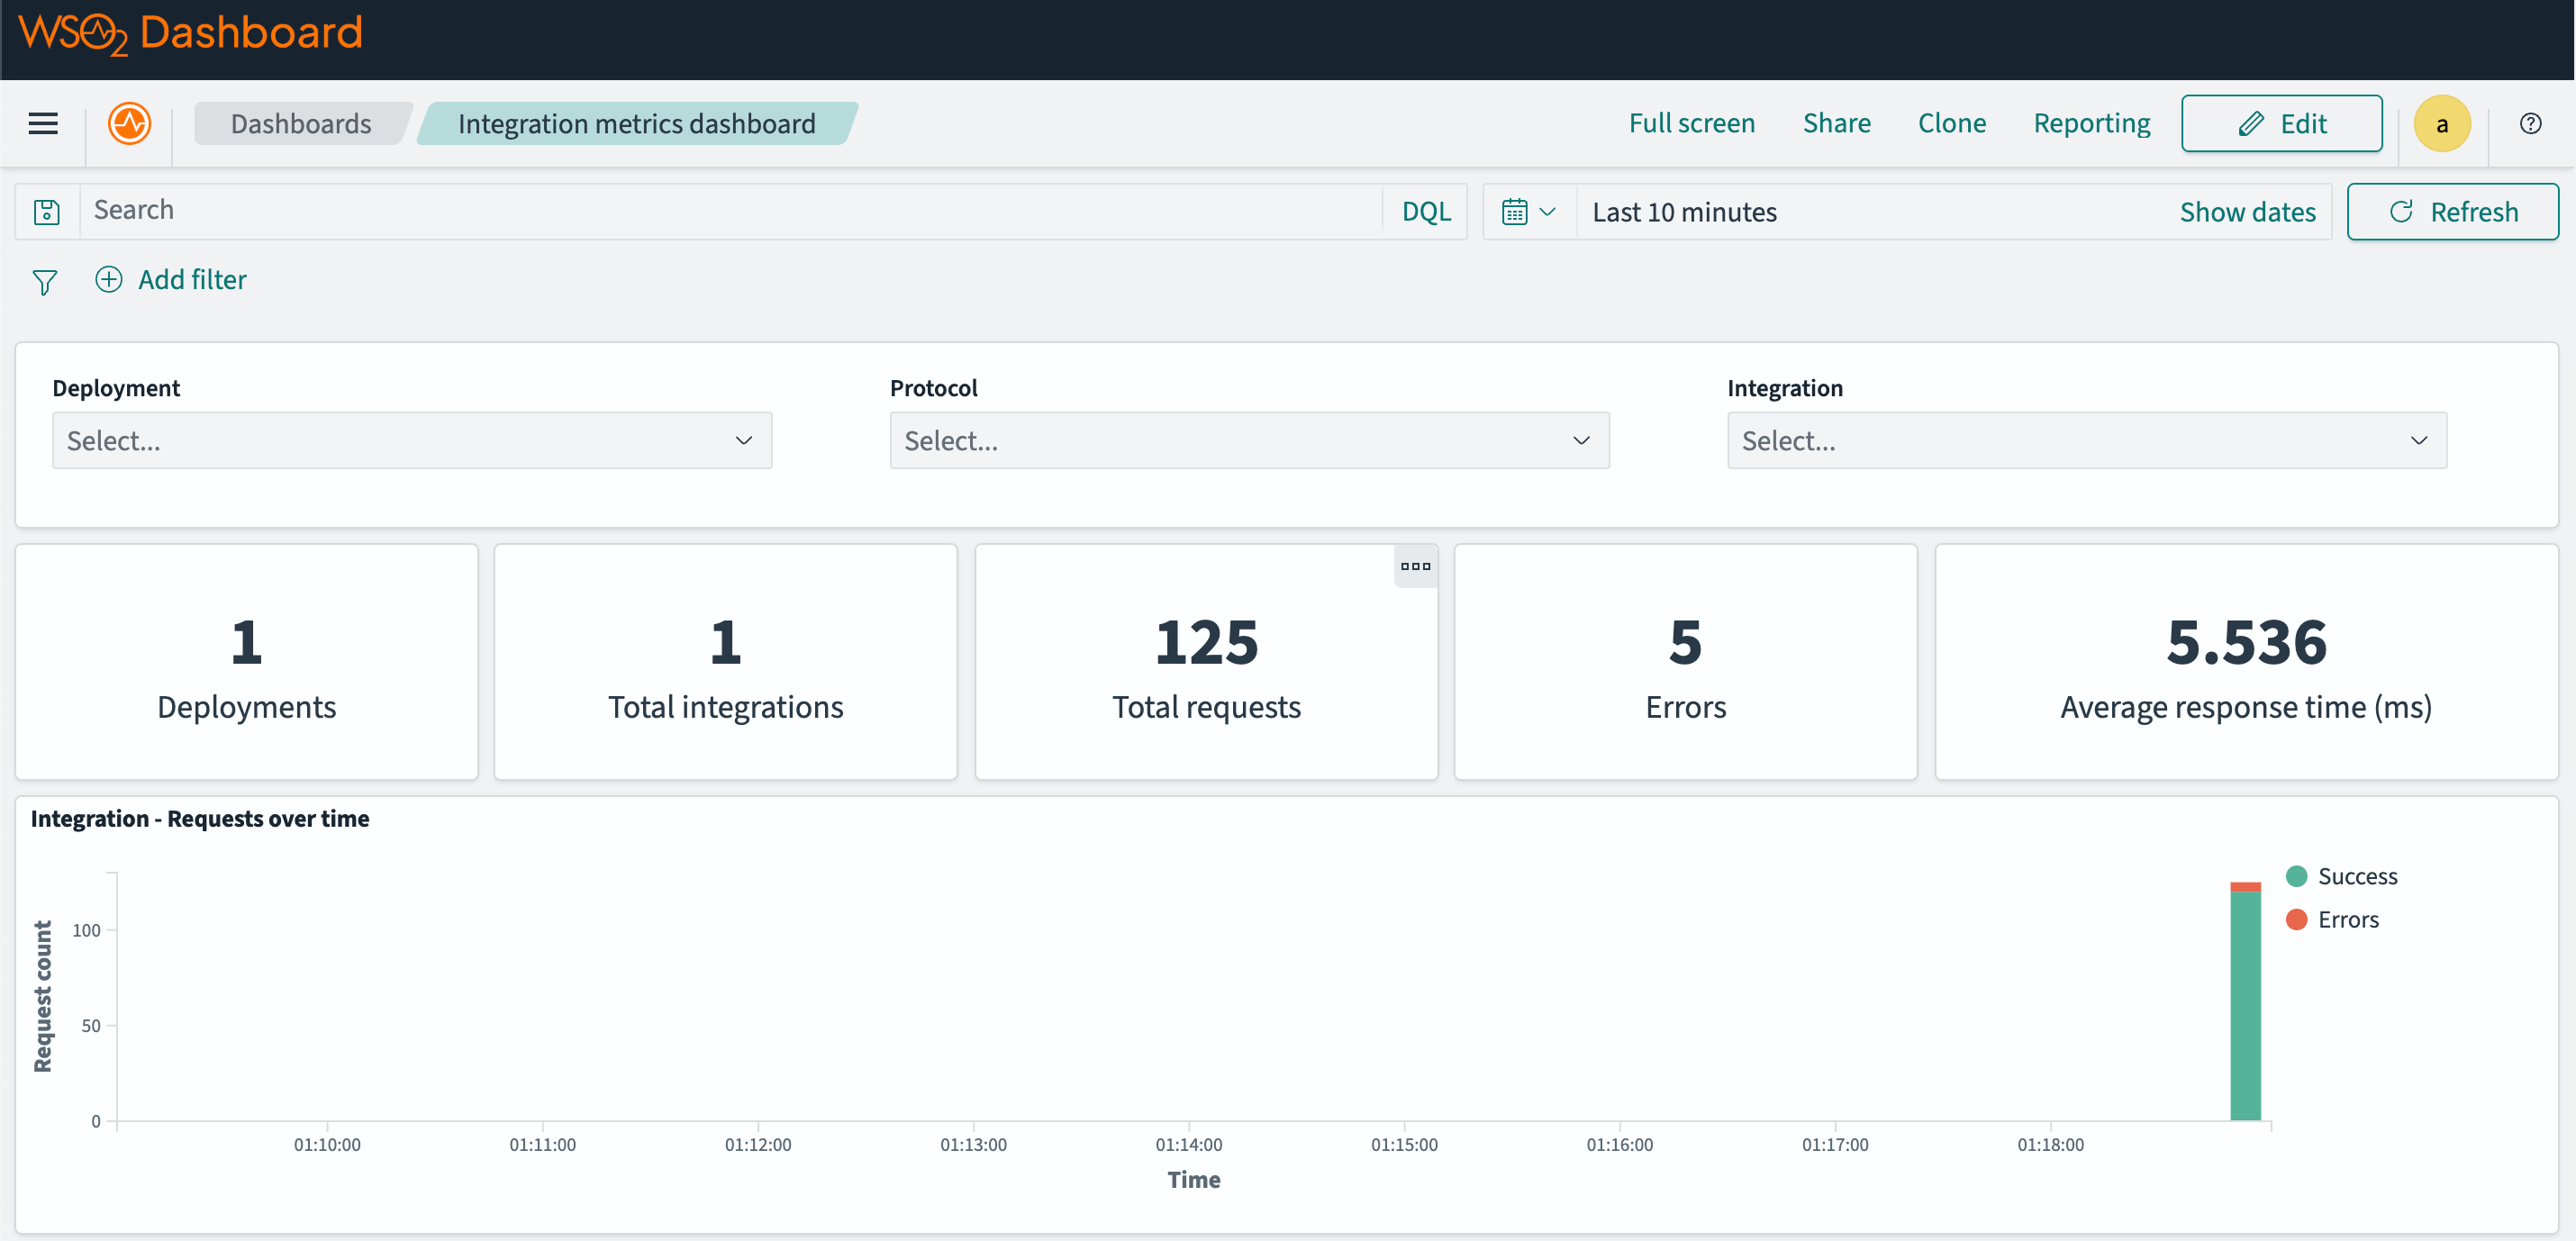
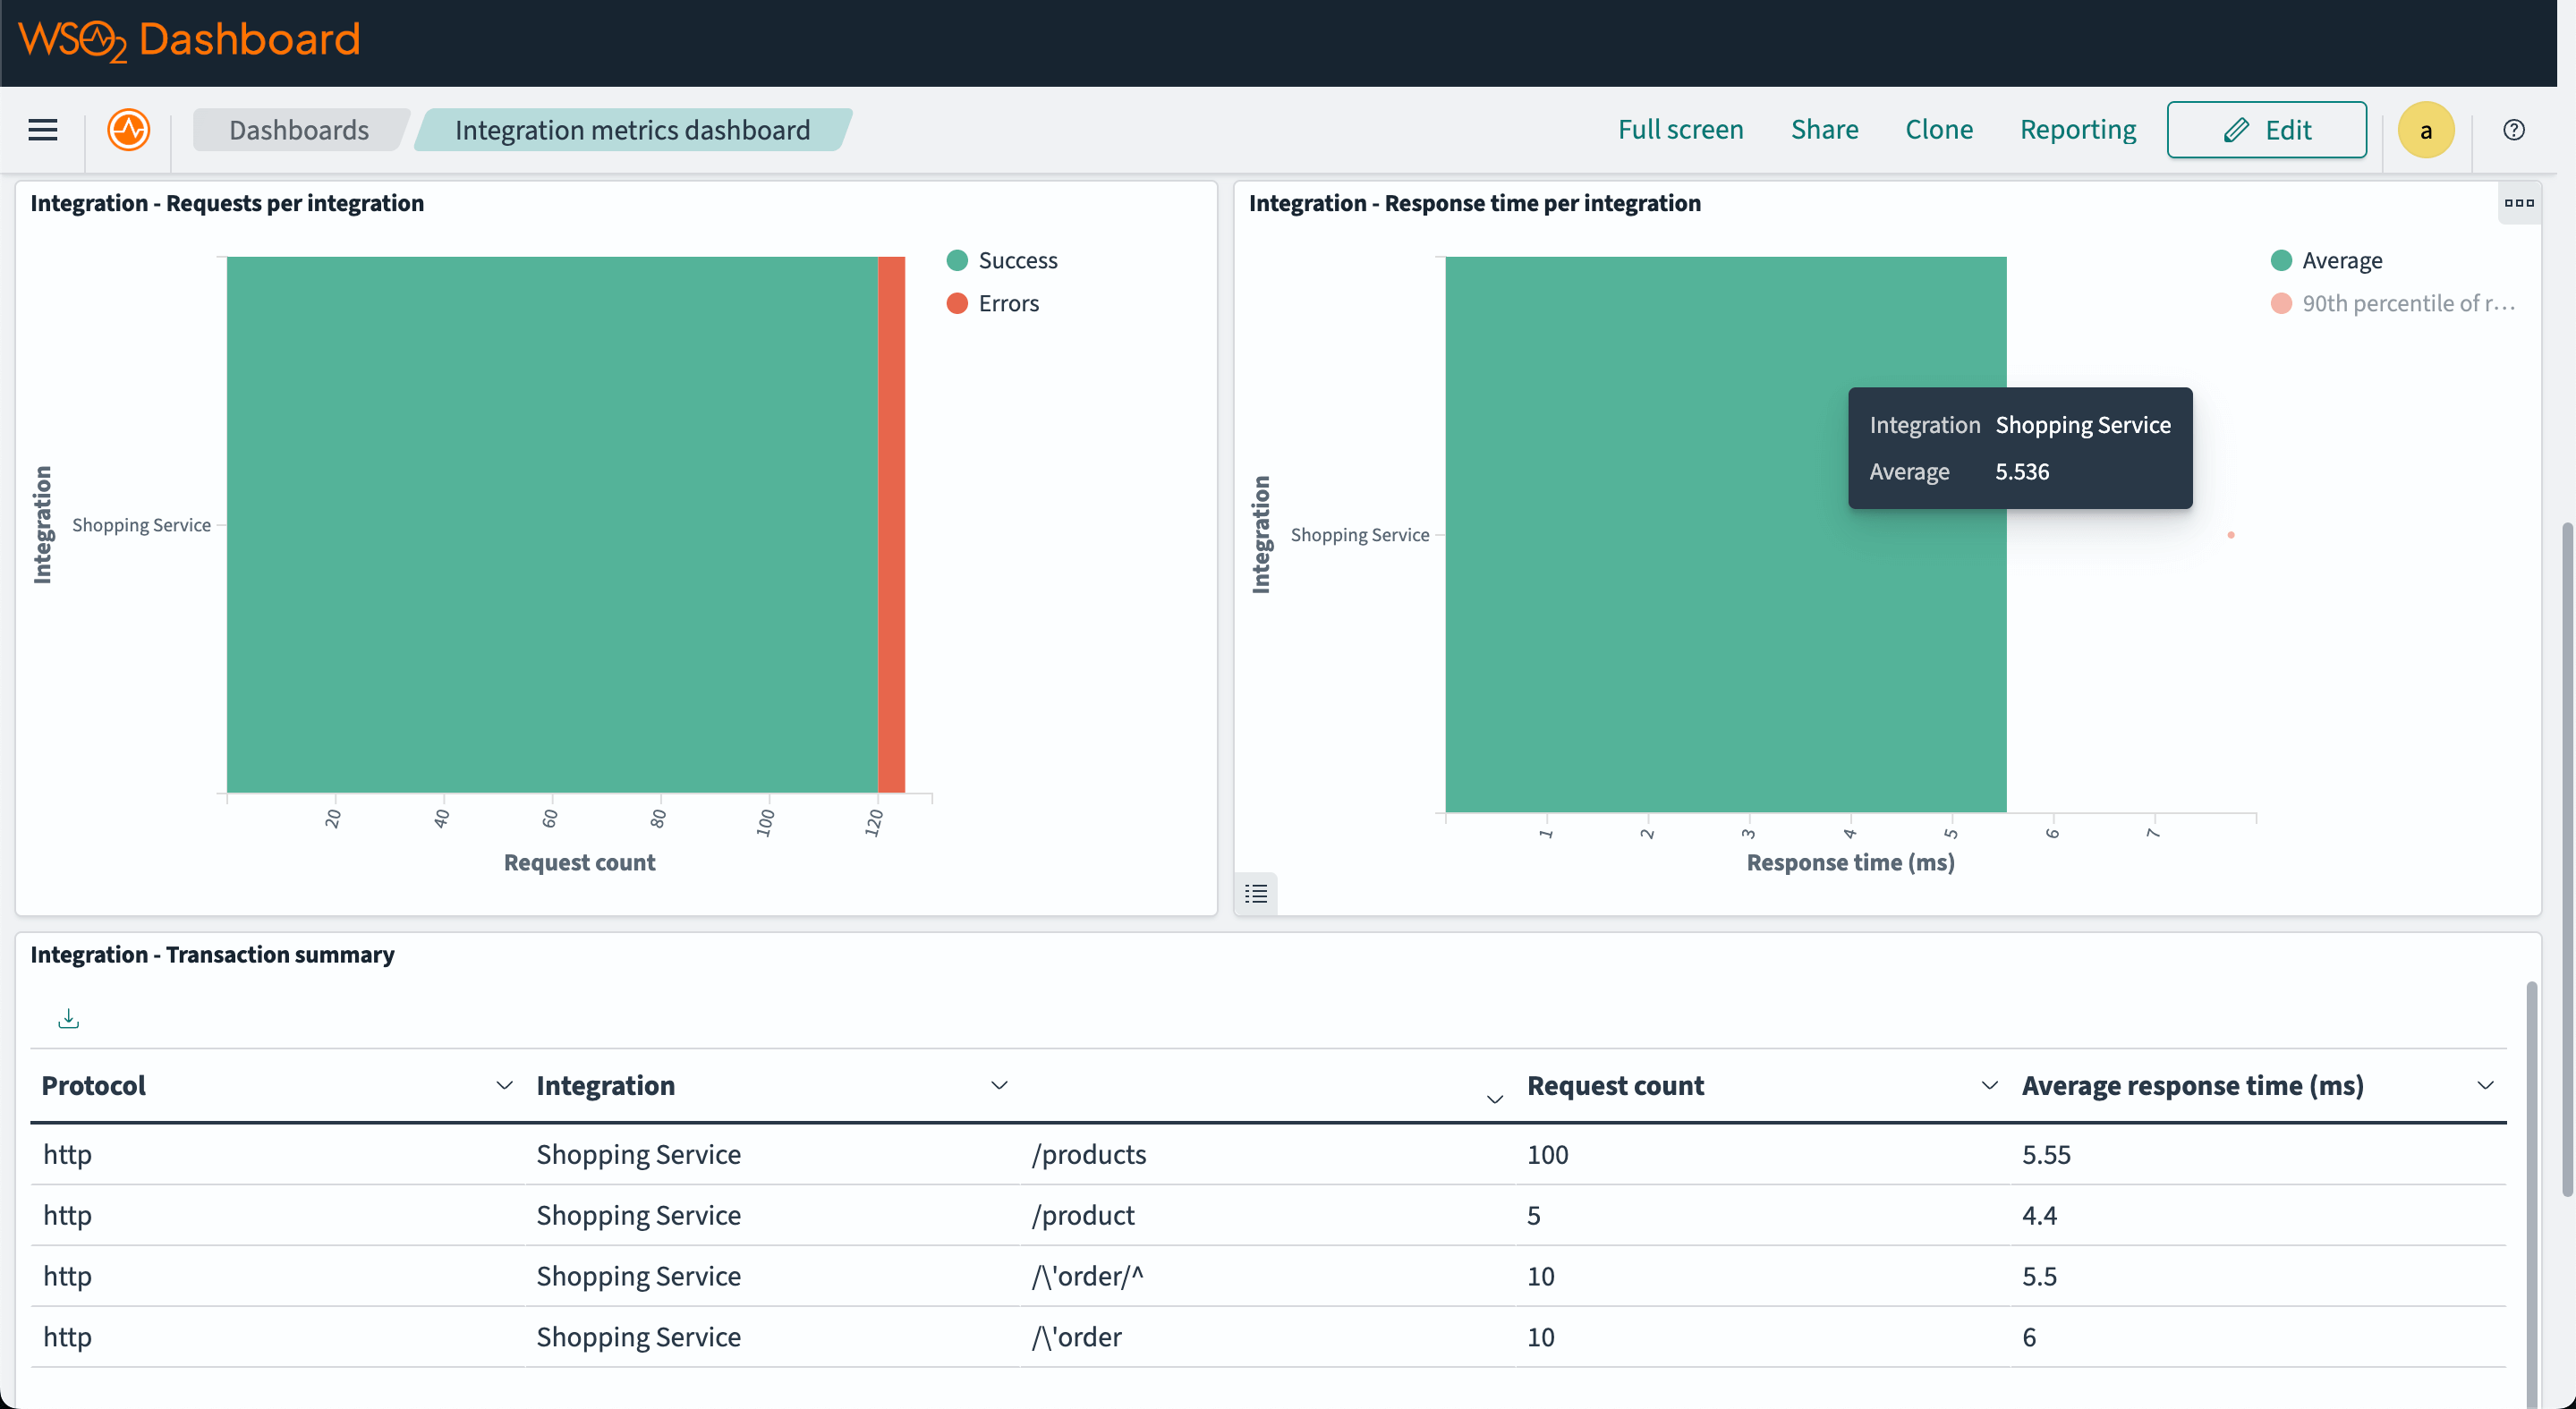
Open the OpenSearch Dashboard in your browser at http://localhost:5601 and navigate to the "Dashboards" tab under "OpenSearch Dashboards" section.
Then click on the "Integration metrics dashboard" to view the metrics.
Step 7 - View logs on OpenSearch dashboard
Open the OpenSearch Dashboard in your browser at http://localhost:5601 and navigate to the "Dashboards" tab under "OpenSearch Dashboards" section.
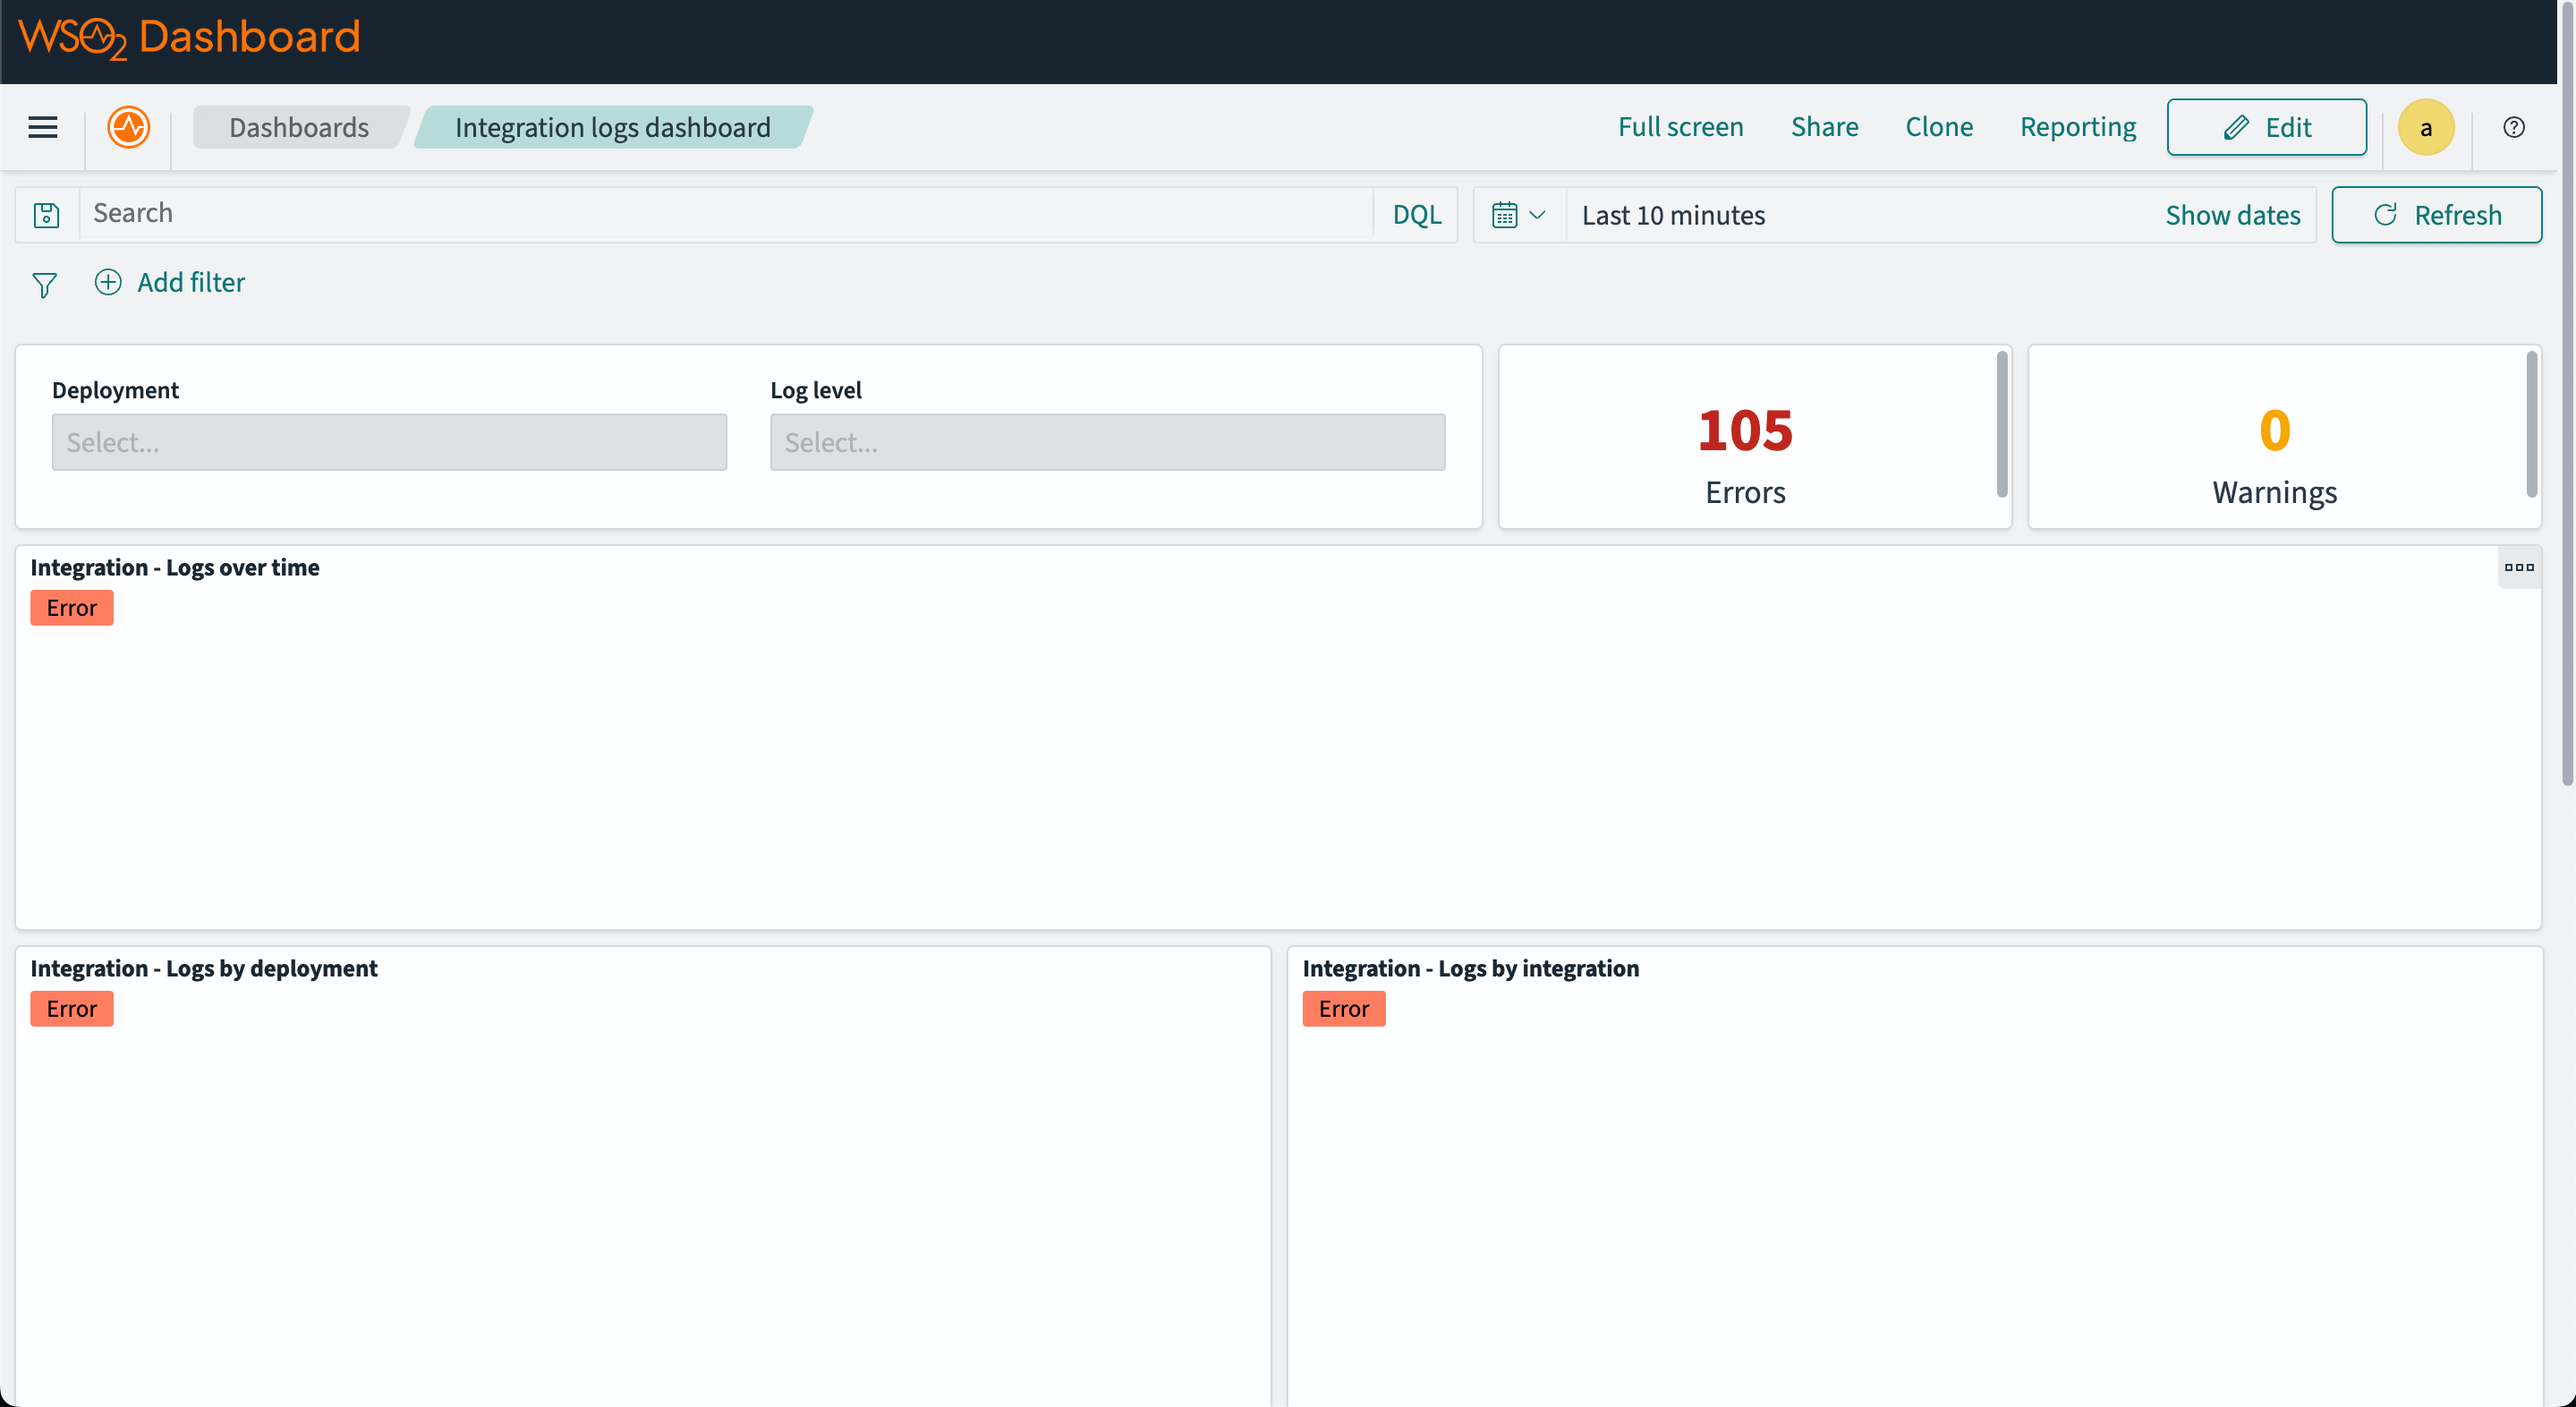
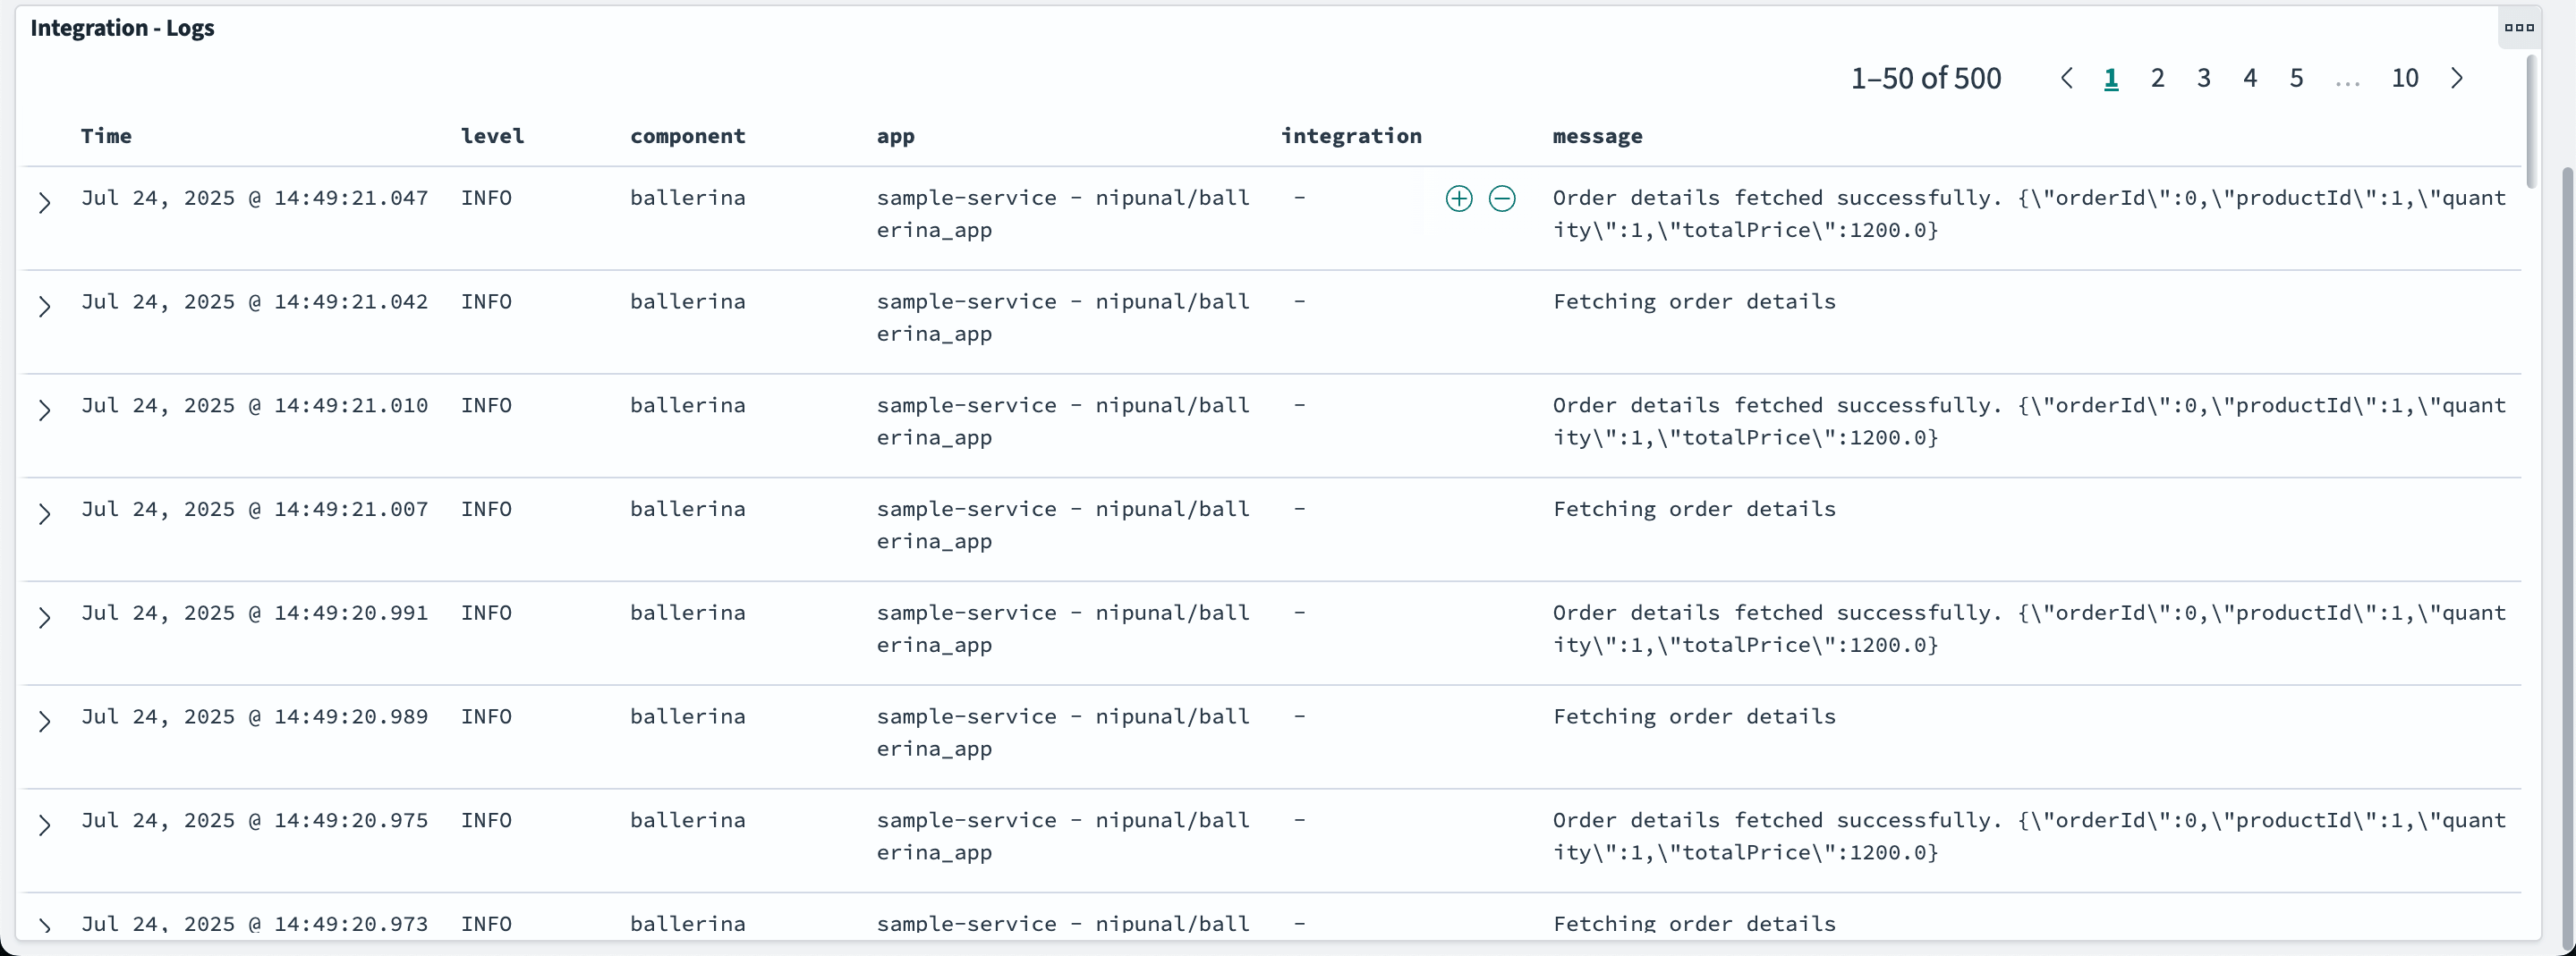
Then click on the "Integration logs dashboard" to view the integration logs.
