- Write a RESTful API with Ballerina
- Write a gRPC service with Ballerina
- Write a GraphQL API with Ballerina
- Work with data using queries in Ballerina
- Build a data service in Ballerina
- Build a Change Data Capture (CDC) service in Ballerina
- Work with Large Language Models (LLMs) using natural expressions
- Deploy Ballerina on Kubernetes
- Manage data persistence with bal persist
- Create your first connector with Ballerina
Users can observe Ballerina programs with Datadog, which is a comprehensive observability and monitoring platform for cloud-scale applications. It provides developers, IT operations teams, and business users with tools to monitor, troubleshoot, and optimize performance across their entire technology stack, including applications, servers, databases, and services. Both metrics and tracing in Ballerina can be viewed with Datadog.
The sample shop service will be used in this guide. Follow the steps given below to observe Ballerina tracing and metrics in Datadog.
Create a new account in Datadog. Select a billing plan according to your needs (A free plan is also included).
Then follow the steps below to set up your Datadog account to view metrics and tracing provided by Ballerina.
Step 1 - Create a Datadog account and an API key
-
Add Prometheus to the Integrations for your account
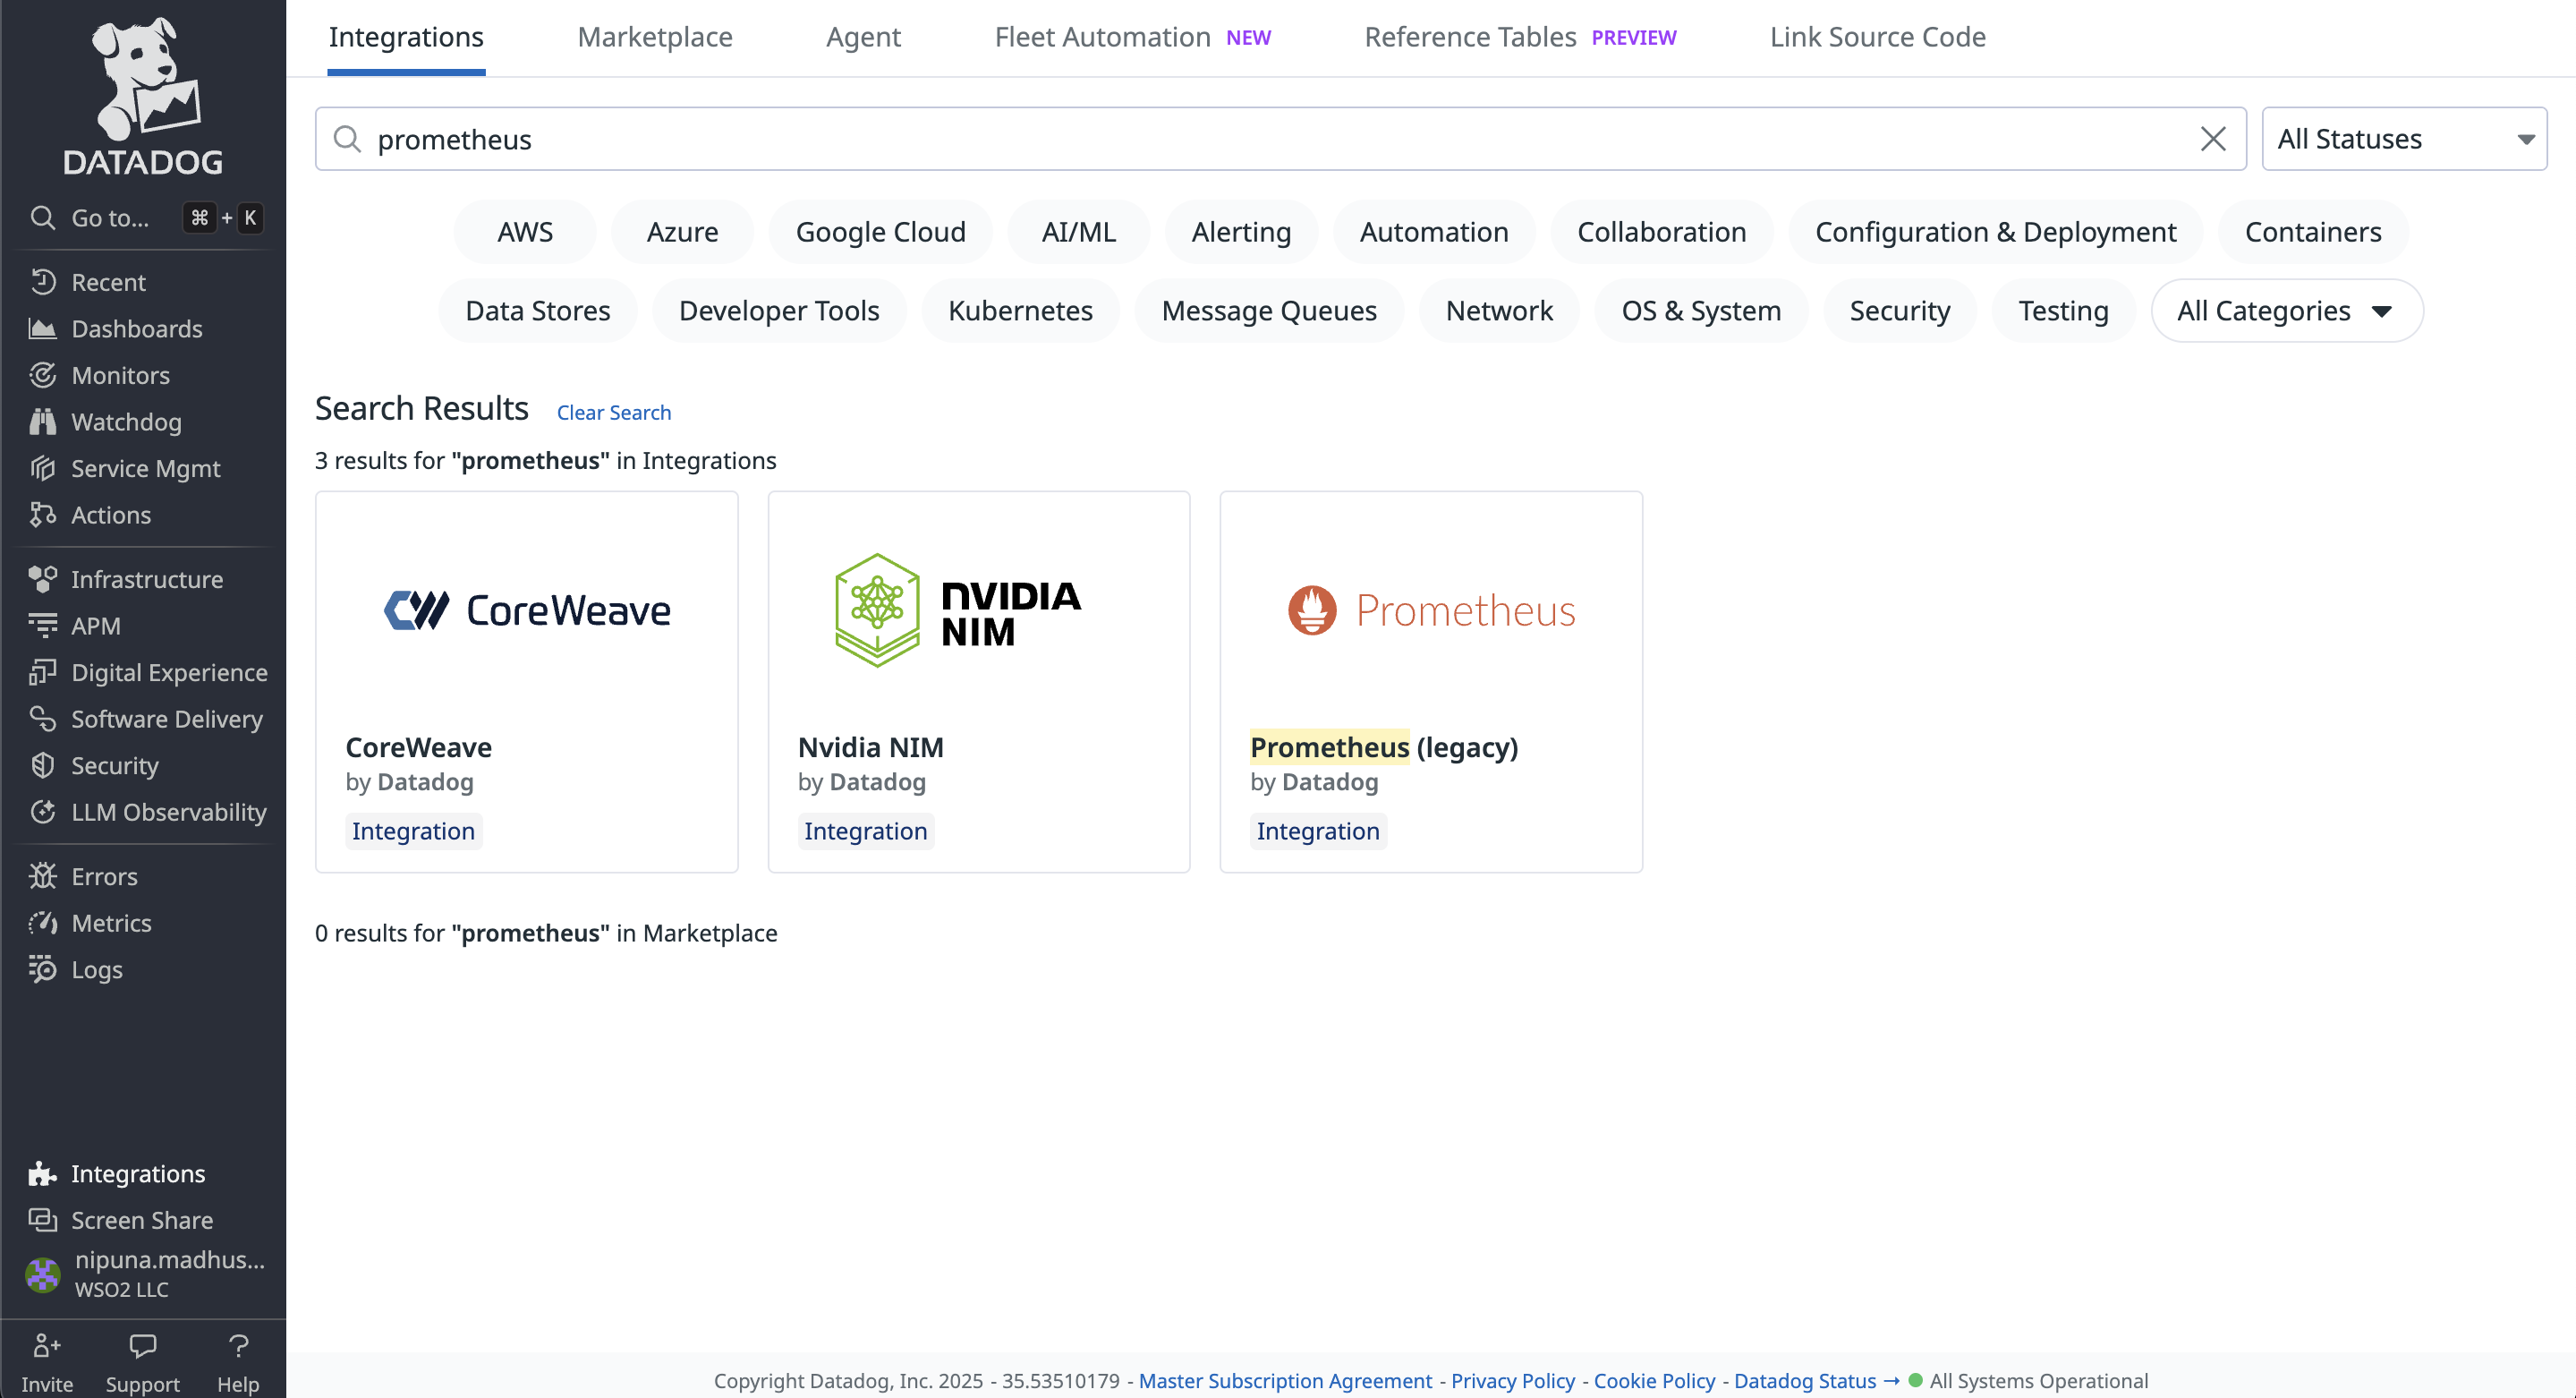
You need to add Prometheus in the Integrations. Please go to the Integrations tab and search for Prometheus.
-
Create an API key
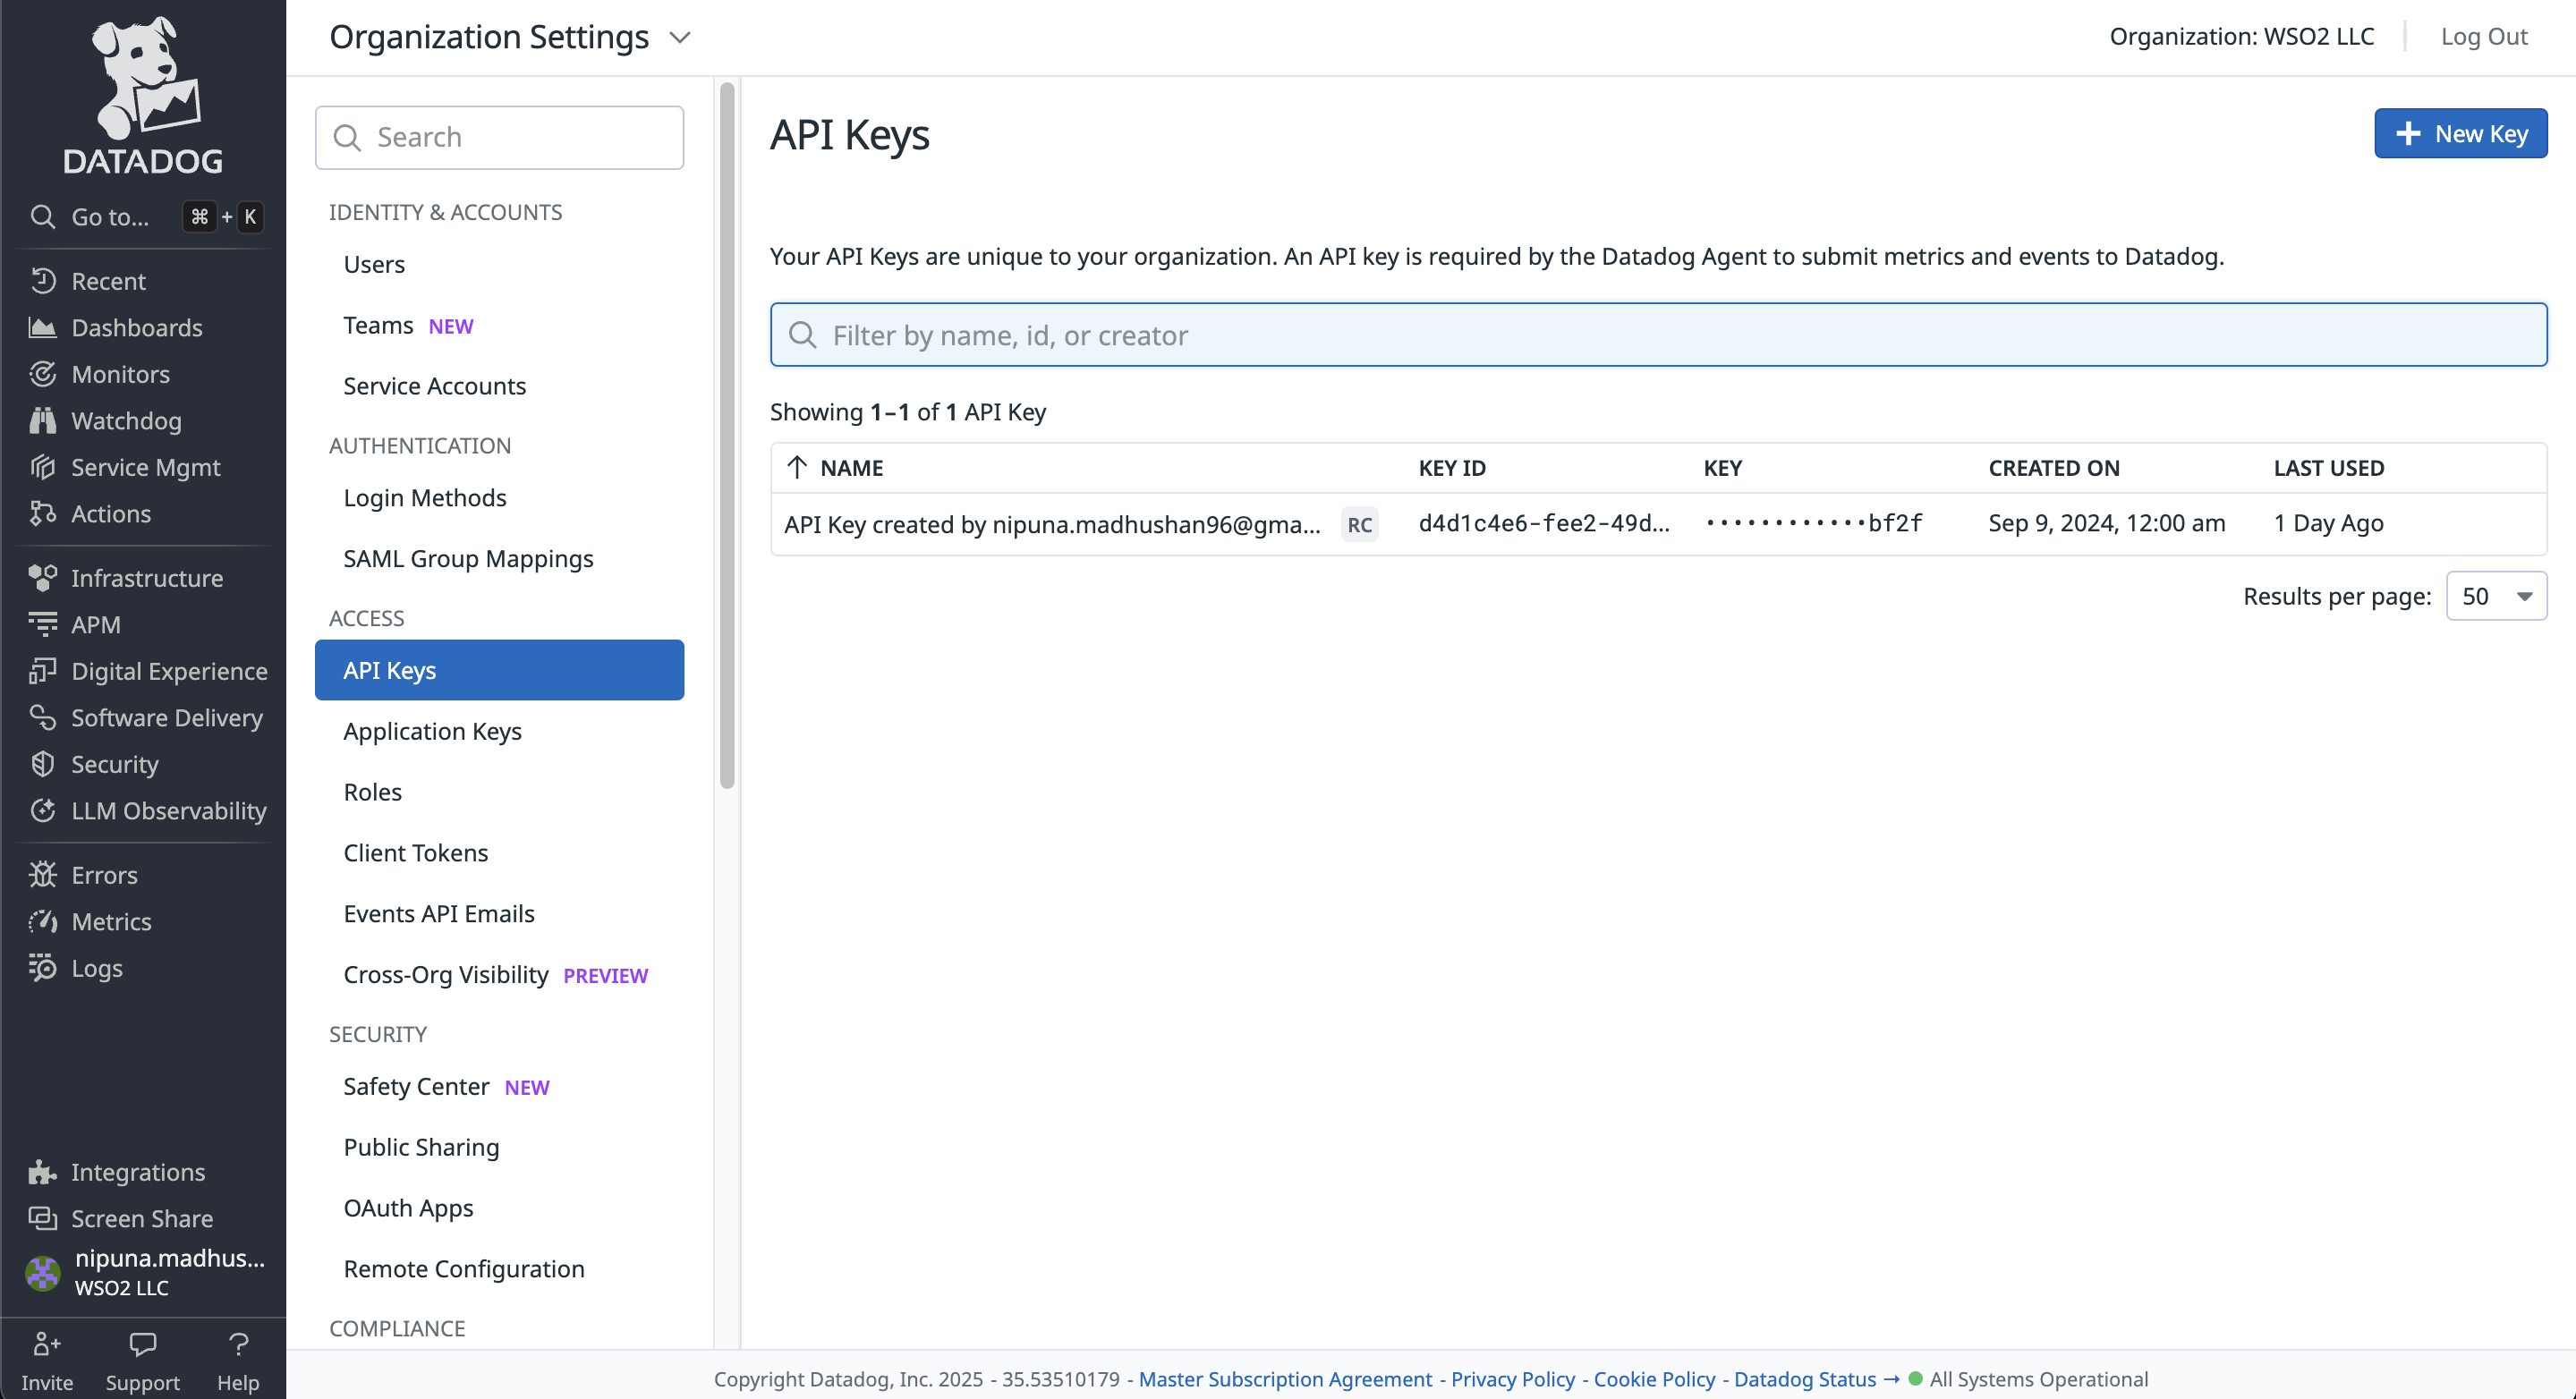
You need to create an API key for the Datadog agent. To create an API key,
Click Profile → Organization Settings → API keys
Step 2 - Set up the Datadog agent
After setting up your Datadog account, you need to set up a Datadog Agent in your instance.
You can follow this documentation to get started with the Datadog agent on your local machine.
You need to include the API key you generated in your Datadog account to datadog.yaml in the datadog-agent/etc folder.
Then follow the steps below to configure metrics and tracing data publishing to Datadog.
-
Add configuration for metrics
Once you add Prometheus by following step 1, you will get a guide to configure a Datadog agent in your instance.
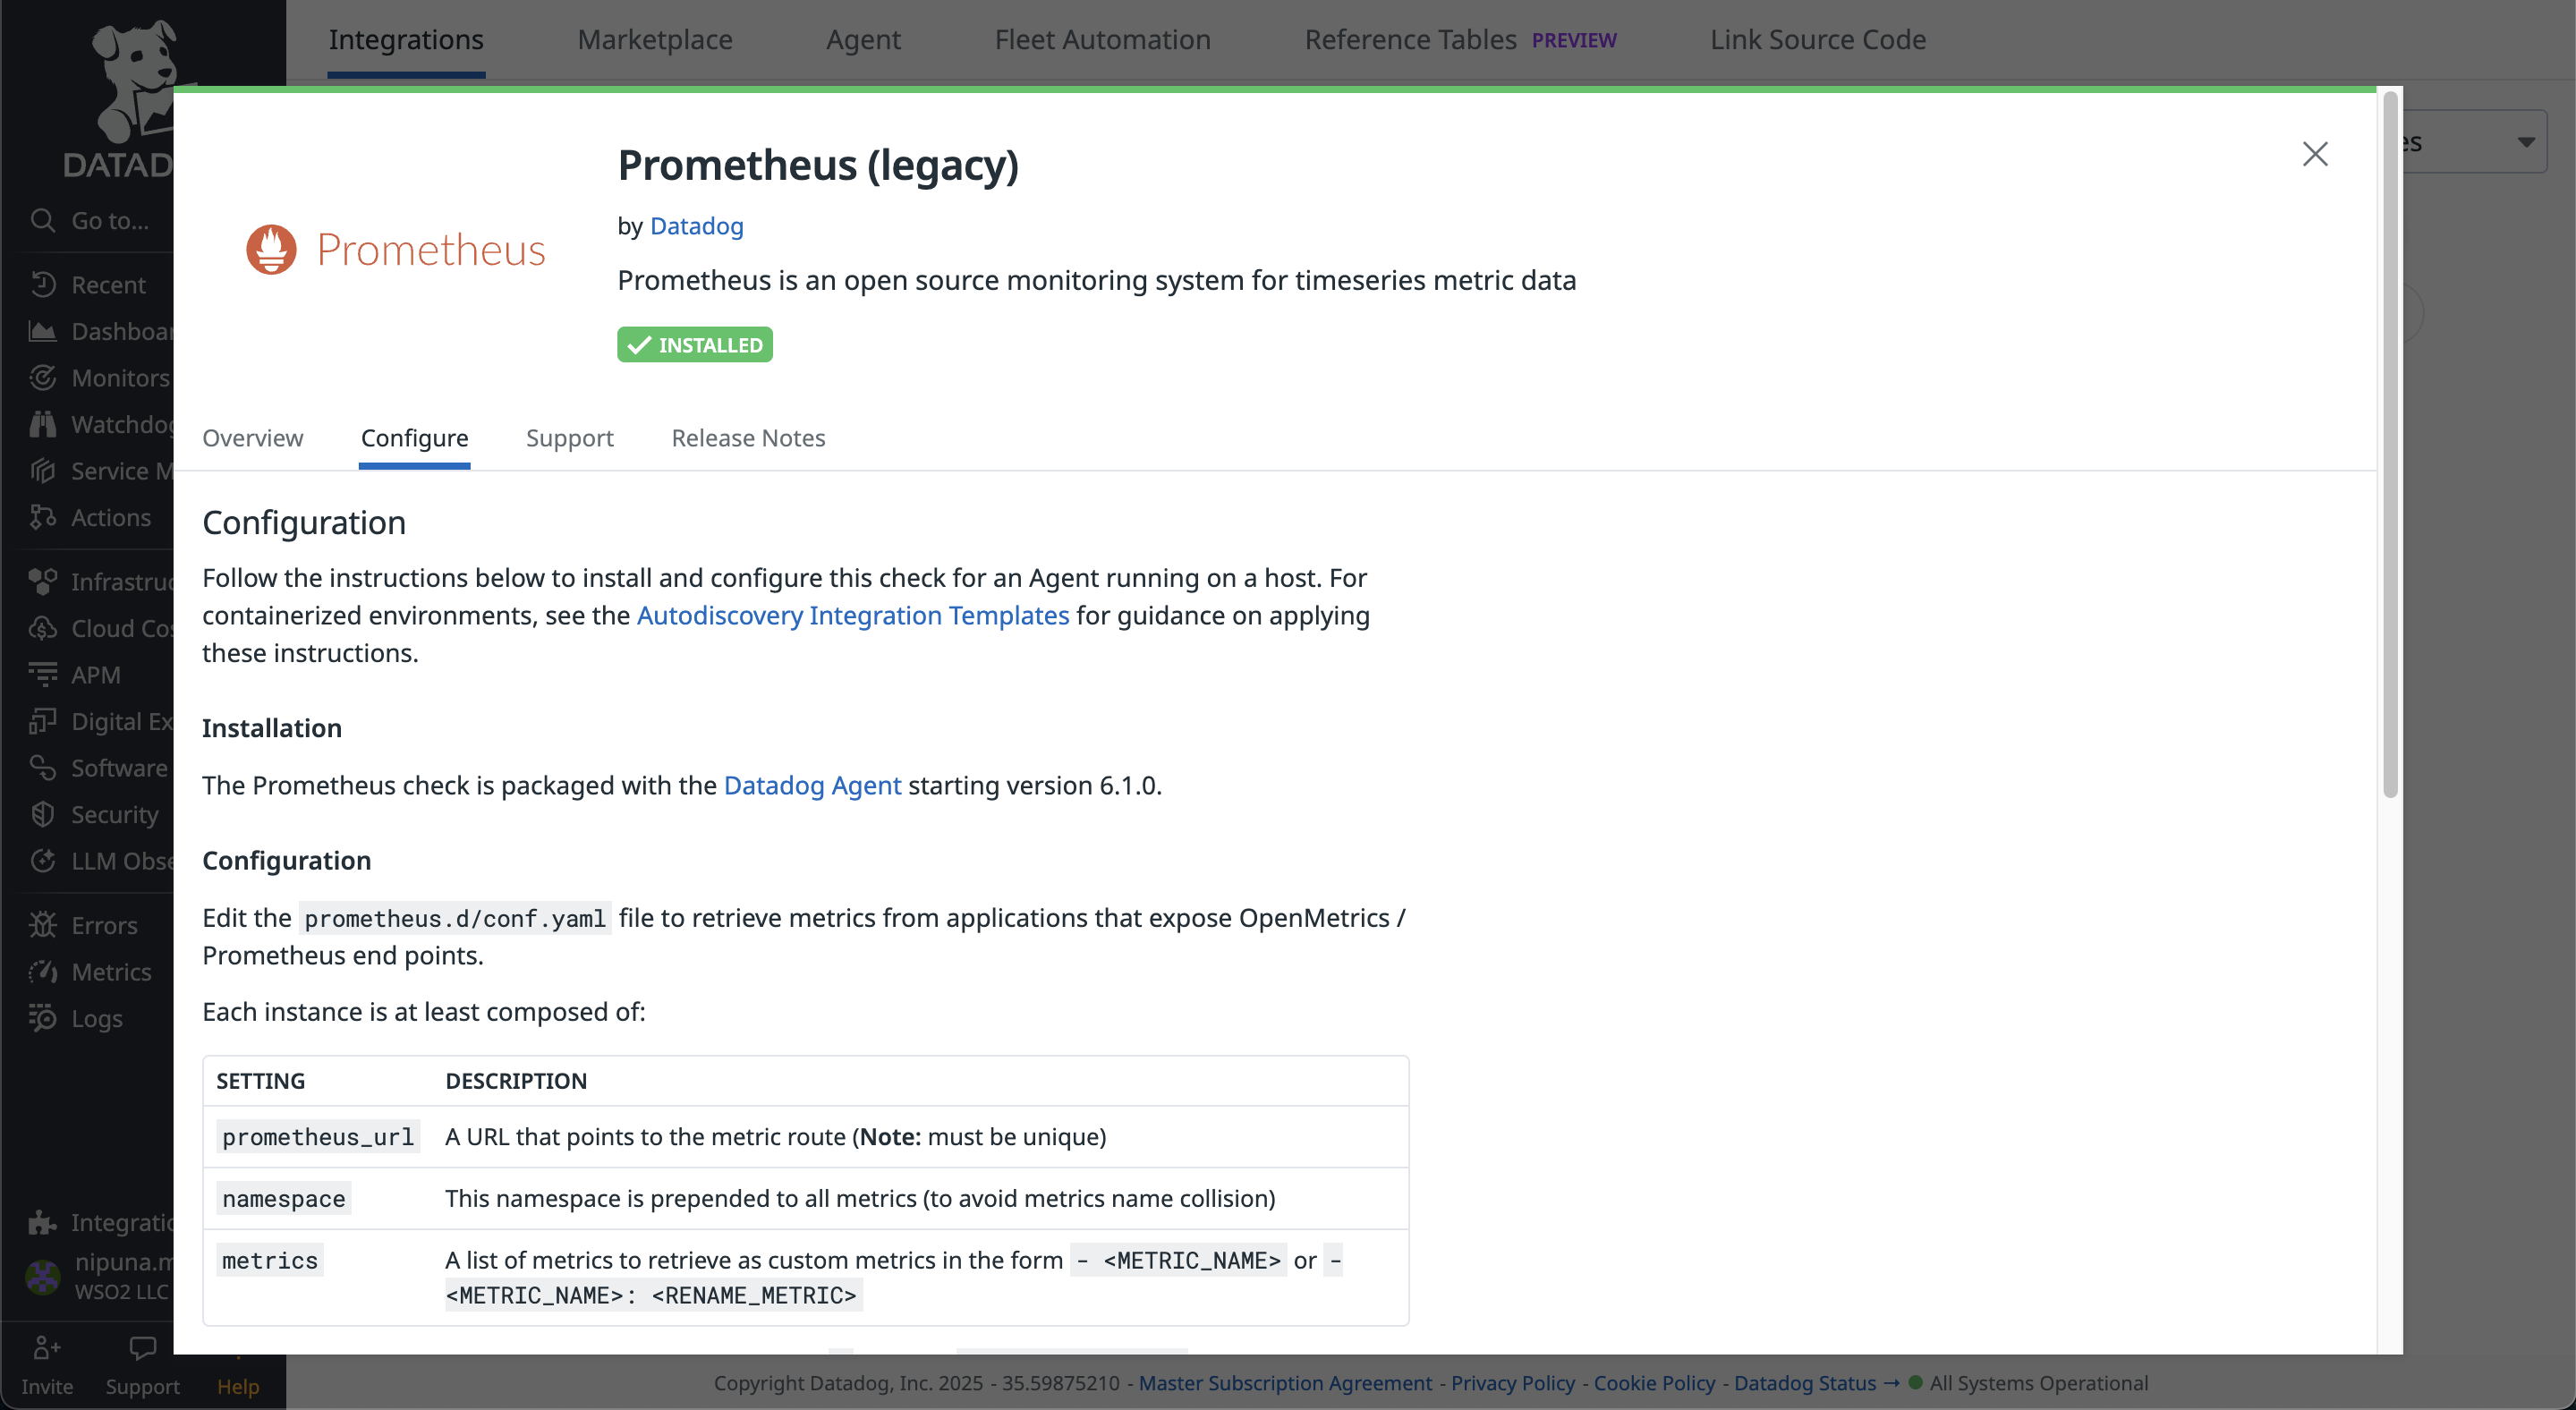
You can follow the instructions given in the above configuration to set up a Datadog agent.
A sample of the conf.yaml file which you should include in the prometheus.d folder can be found here.
init_config: instances: - prometheus_url: http://localhost:9797/metrics namespace: ballerina metrics: - response_time_seconds_value - response_time_seconds_max - response_time_seconds_min - response_time_seconds_mean - response_time_seconds_stdDev - response_time_seconds - response_time_nanoseconds_total_value - requests_total_value - response_errors_total_value - inprogress_requests_value - kafka_publishers_value - kafka_consumers_value - kafka_errors_value headers: Accept: "text/plain; version=0.0.4" -
Add configuration for tracing
You need to use the following configurations in the
datadog.yaml.To view traces in Datadog, we need to enable the APM (Application Performance Monitoring) in your Datadog agent.
apm_config: enabled: trueBallerina uses OpenTelemetry to provide traces. Therefore, we need to set up OpenTelemetry configurations as follows.
otlp_config: receiver: protocols: grpc: endpoint: 0.0.0.0:4317
Step 3 - Import Ballerina Prometheus and Jaeger extensions
To include the Prometheus and Jaeger extensions into the executable, the ballerinax/prometheus and ballerinax/jaeger modules need to be imported into your Ballerina project main.bal file.
import ballerinax/prometheus as _; import ballerinax/jaeger as _;
To support Prometheus as the metrics reporter, an HTTP endpoint starts with the context of /metrics in default port 9797 when starting the Ballerina service.
Jaeger extension has an Opentelemetry GRPC Span Exporter which will push tracing data as batches to the endpoint (default - http://localhost:4317) in opentelemetry format.
Step 4 - Configure Ballerina runtime configurations
Tracing and metrics can be enabled in your Ballerina project using configurations similar to the following in your Config.toml file.
[ballerina.observe] tracingEnabled=true tracingProvider="jaeger" metricsEnabled=true metricsReporter="prometheus" [ballerinax.prometheus] port=9797 host="0.0.0.0" [ballerinax.jaeger] agentHostname="localhost" agentPort=4317 samplerType="const" samplerParam=1.0 reporterFlushInterval=2000 reporterBufferSize=1000
The table below provides the descriptions of each configuration option and possible values that can be assigned.
| Configuration key | Description | Default value | Possible values |
|---|---|---|---|
| ballerinax.prometheus. port | The value of the port to which the '/metrics' service will bind. This service will be used by Prometheus to scrape the information of the Ballerina service. | 9797 | Any suitable value for port 0 - 0 - 65535. However, within that range, ports 0 - 1023 are generally reserved for specific purposes, therefore it is advisable to select a port without that range. |
| ballerinax.prometheus. host | The name of the host to which the '/metrics' service will bind. This service will be used by Prometheus to scrape the information of the Ballerina service. | 0.0.0.0 | IP or Hostname or 0.0.0.0 of the node in which the Ballerina service is running. |
| ballerinax.jaeger. agentHostname | Hostname of the Jaeger agent | localhost | IP or hostname of the Jaeger agent. If it is running on the same node as Ballerina, it can be localhost. |
| ballerinax.jaeger. agentPort | Port of the Jaeger agent | 4317 | The port on which the Jaeger agent is listening. |
| ballerinax.jaeger. samplerType | Type of the sampling methods used in the Jaeger tracer. | const | const, probabilistic, or ratelimiting. |
| ballerinax.jaeger. samplerParam | It is a floating value. Based on the sampler type, the effect of the sampler param varies | 1.0 | For const 0 (no sampling) or 1 (sample all spans), for probabilistic 0.0 to 1.0, for ratelimiting any positive integer (rate per second). |
| ballerinax.jaeger. reporterFlushInterval | The Jaeger client will be sending the spans to the agent at this interval. | 2000 | Any positive integer value. |
| ballerinax.jaeger. reporterBufferSize | Queue size of the Jaeger client. | 1000 | Any positive integer value. |
Step 5 - Run the Ballerina service
When Ballerina observability is enabled, the Ballerina runtime collects tracing and metrics data and will be published to Datadog.
Run the following command to start the Ballerina service.
$ bal run Compiling source Running executable ballerina: started Prometheus HTTP listener 0.0.0.0:9797 ballerina: started publishing traces to Jaeger on localhost:4317
Step 6 - Send requests
Send requests to http://localhost:8090/shop/products.
Example cURL commands:
$ curl -X GET http://localhost:8090/shop/products
$ curl -X POST http://localhost:8090/shop/product \ -H "Content-Type: application/json" \ -d '{ "id": 4, "name": "Laptop Charger", "price": 50.00 }'
$ curl -X POST http://localhost:8090/shop/order \ -H "Content-Type: application/json" \ -d '{ "productId": 1, "quantity": 1 }'
$ curl -X GET http://localhost:8090/shop/order/0
Step 7 - View metrics on Datadog
You can observe the metrics in the Datadog platform under the Metrics tab in the left navigation.
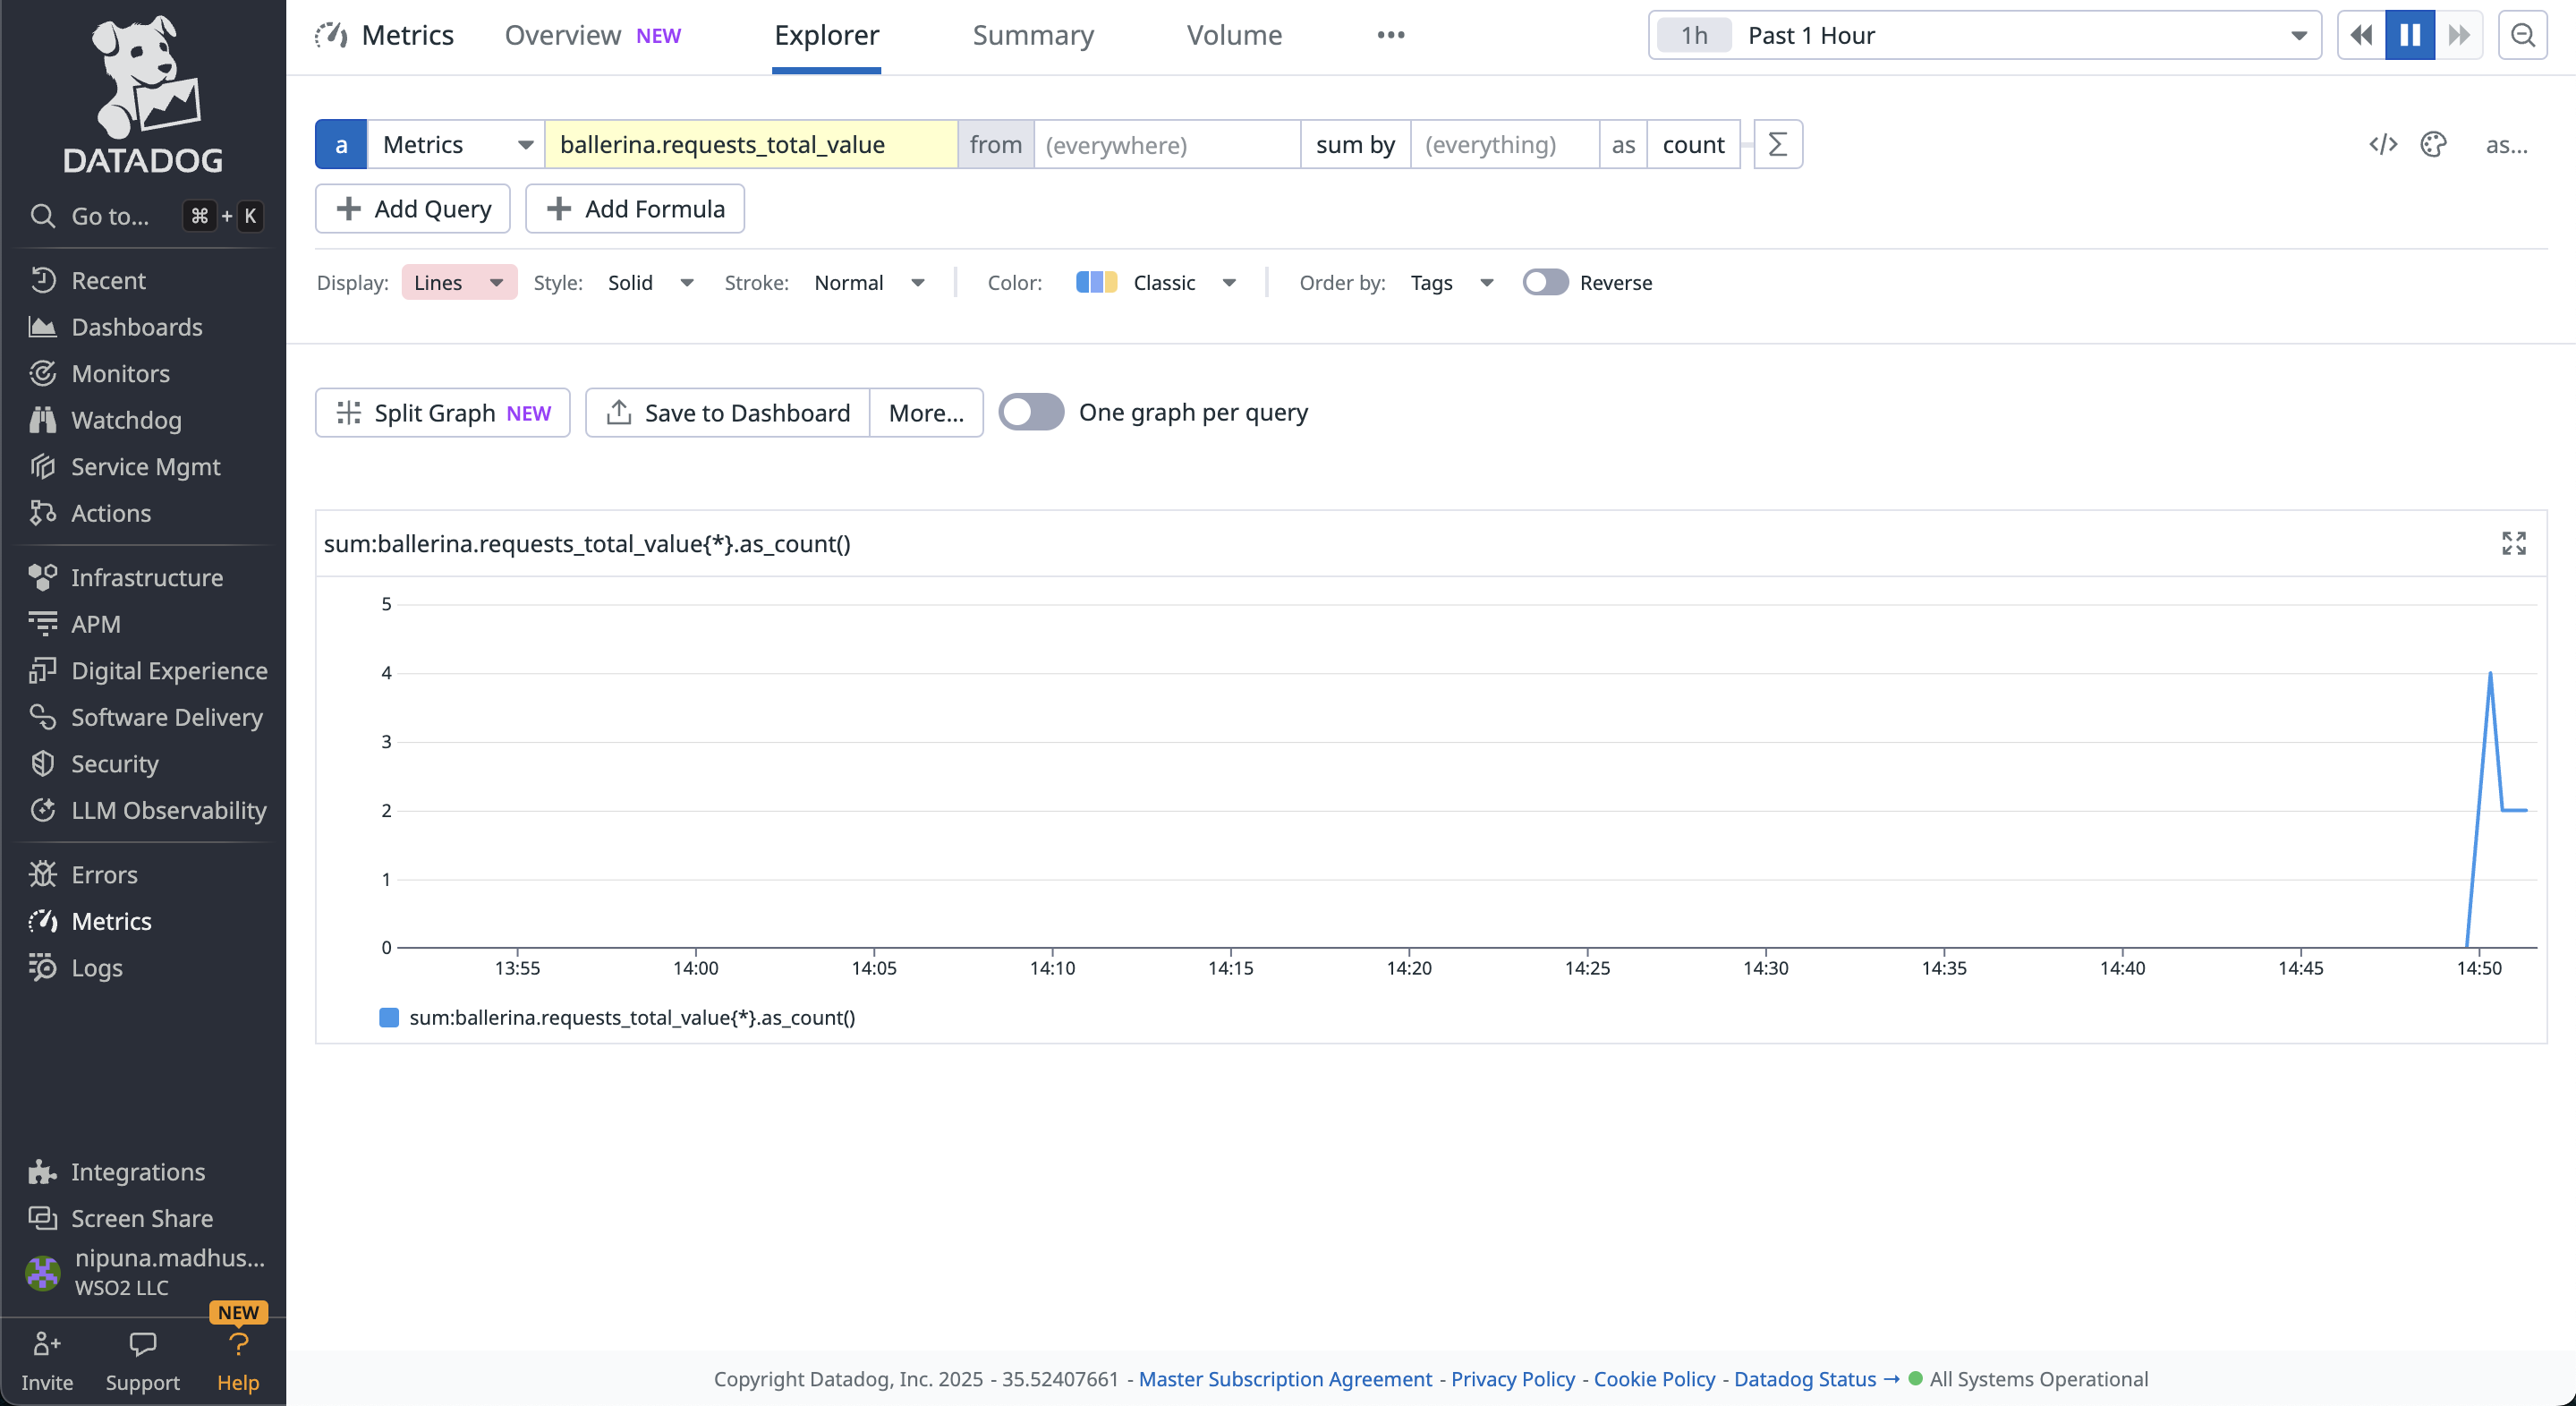
You can add filters and use functions in the Datadog to visualize what you want with the metrics provided by Ballerina.
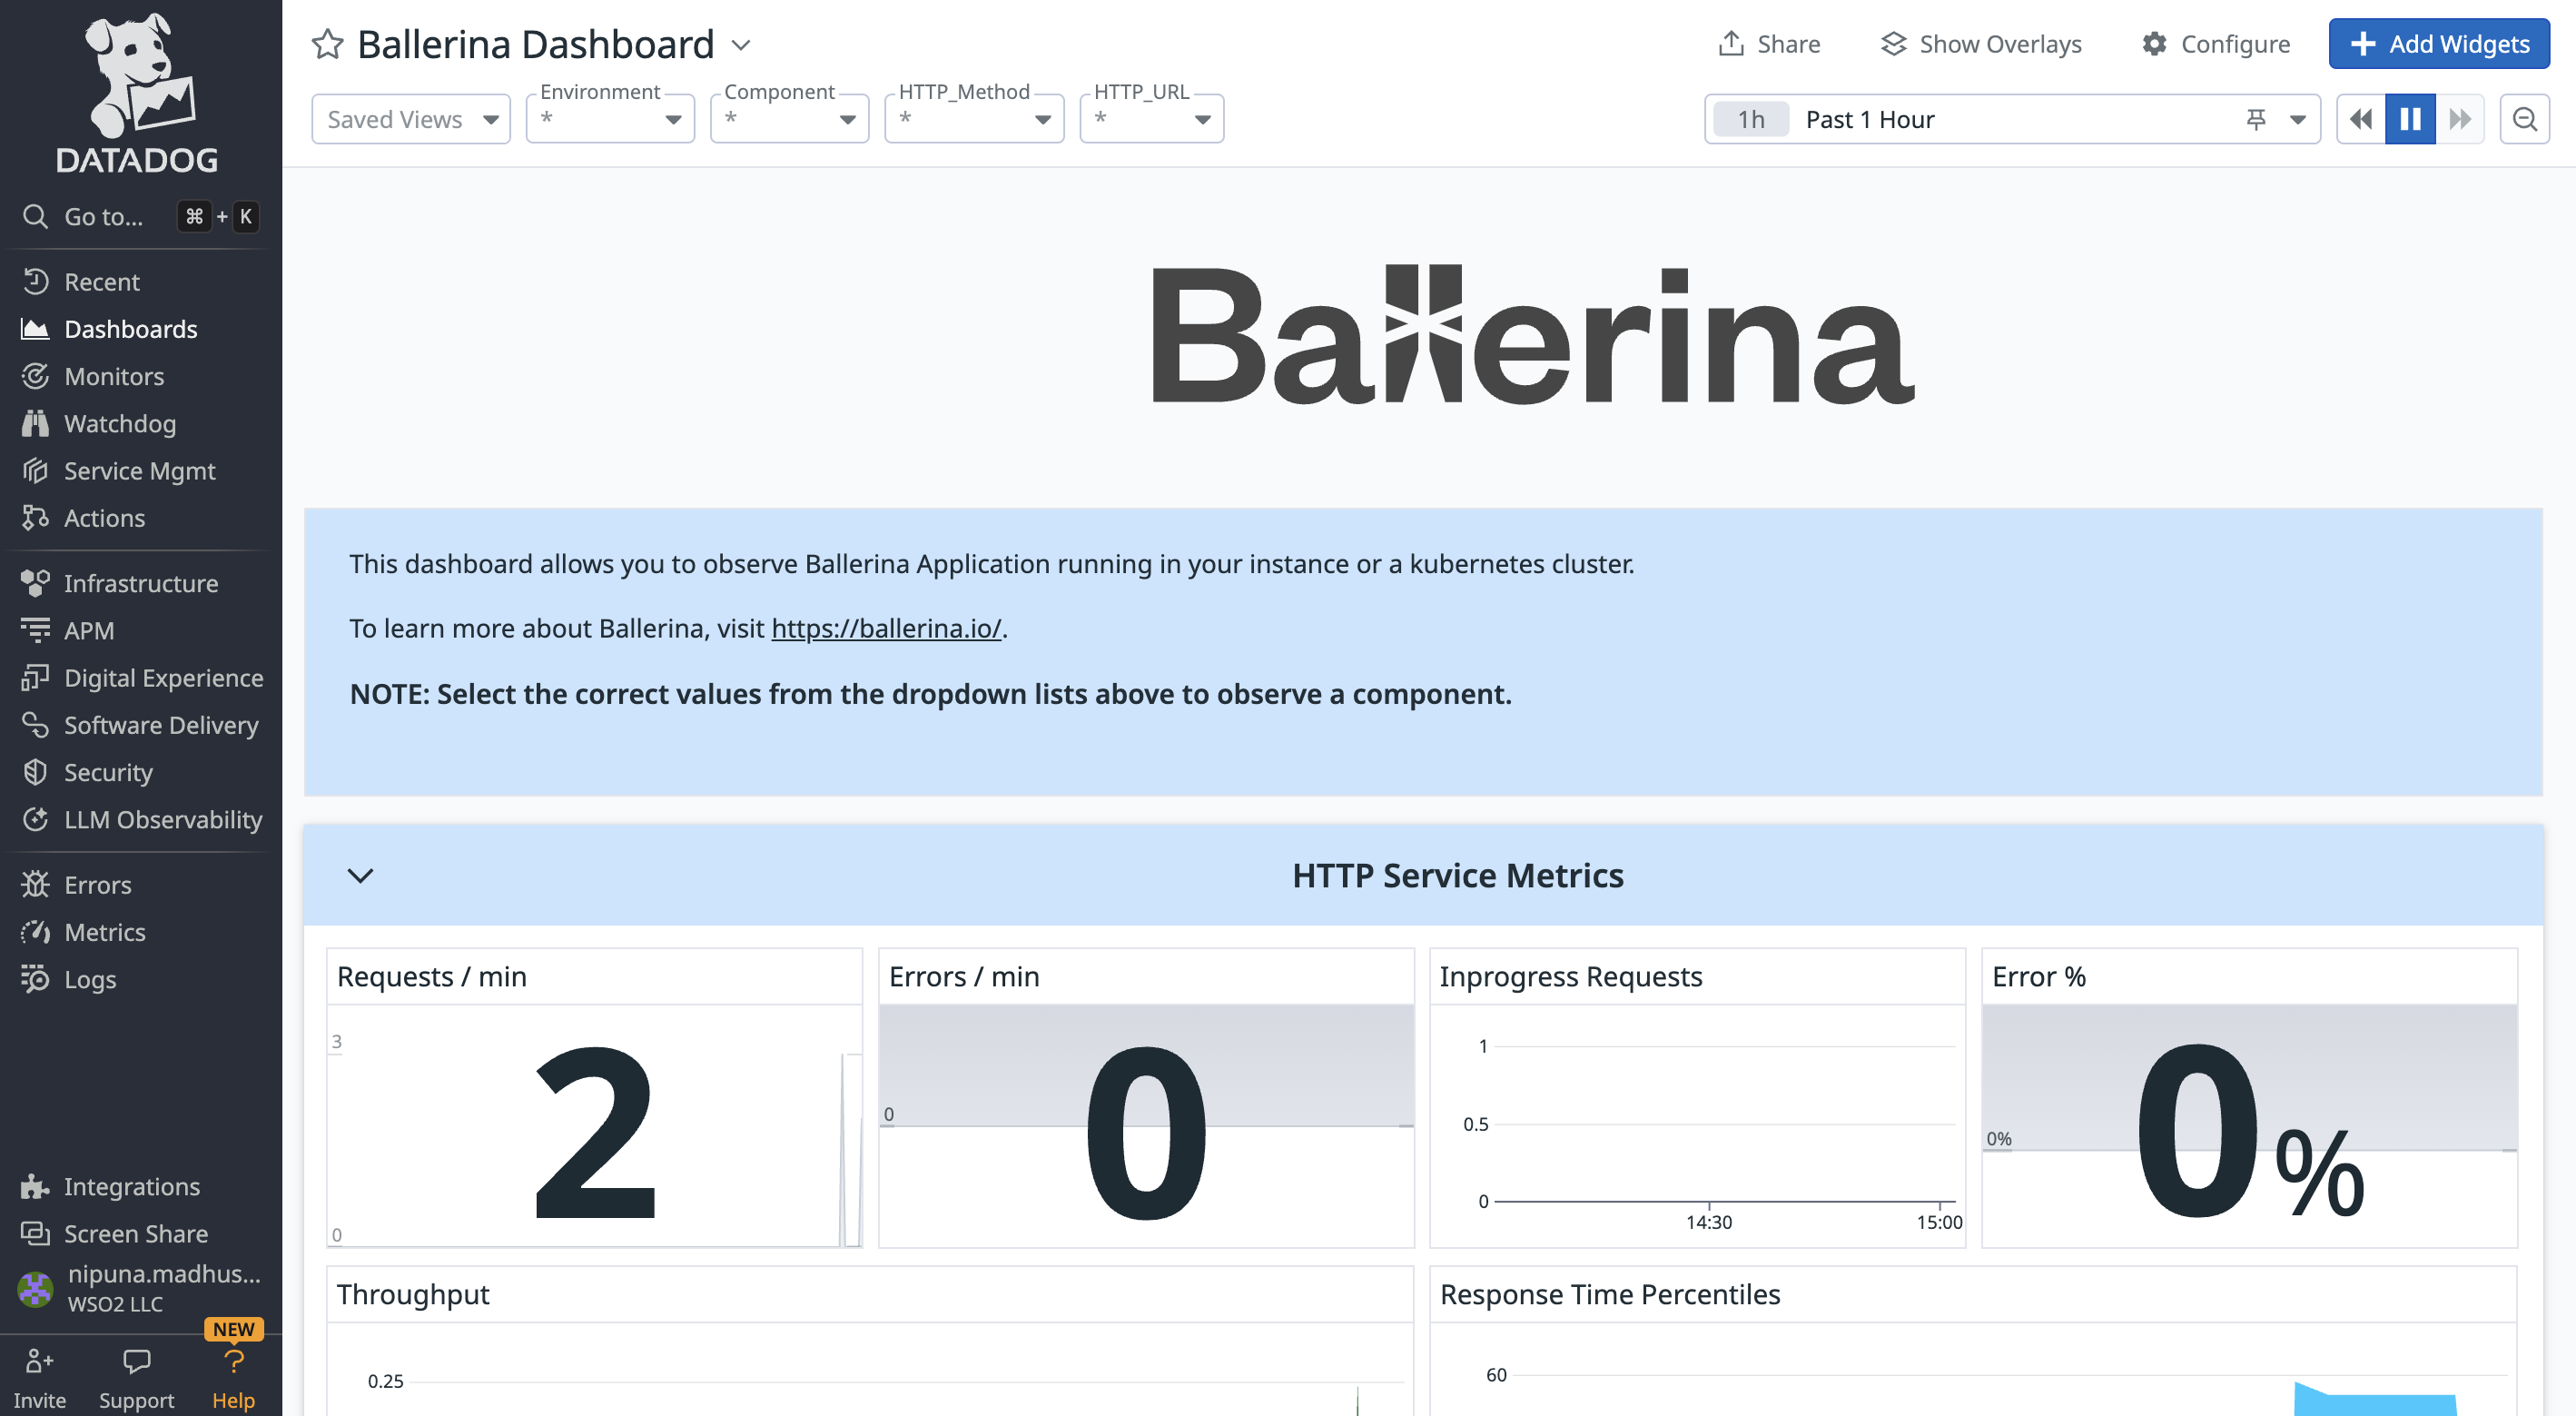
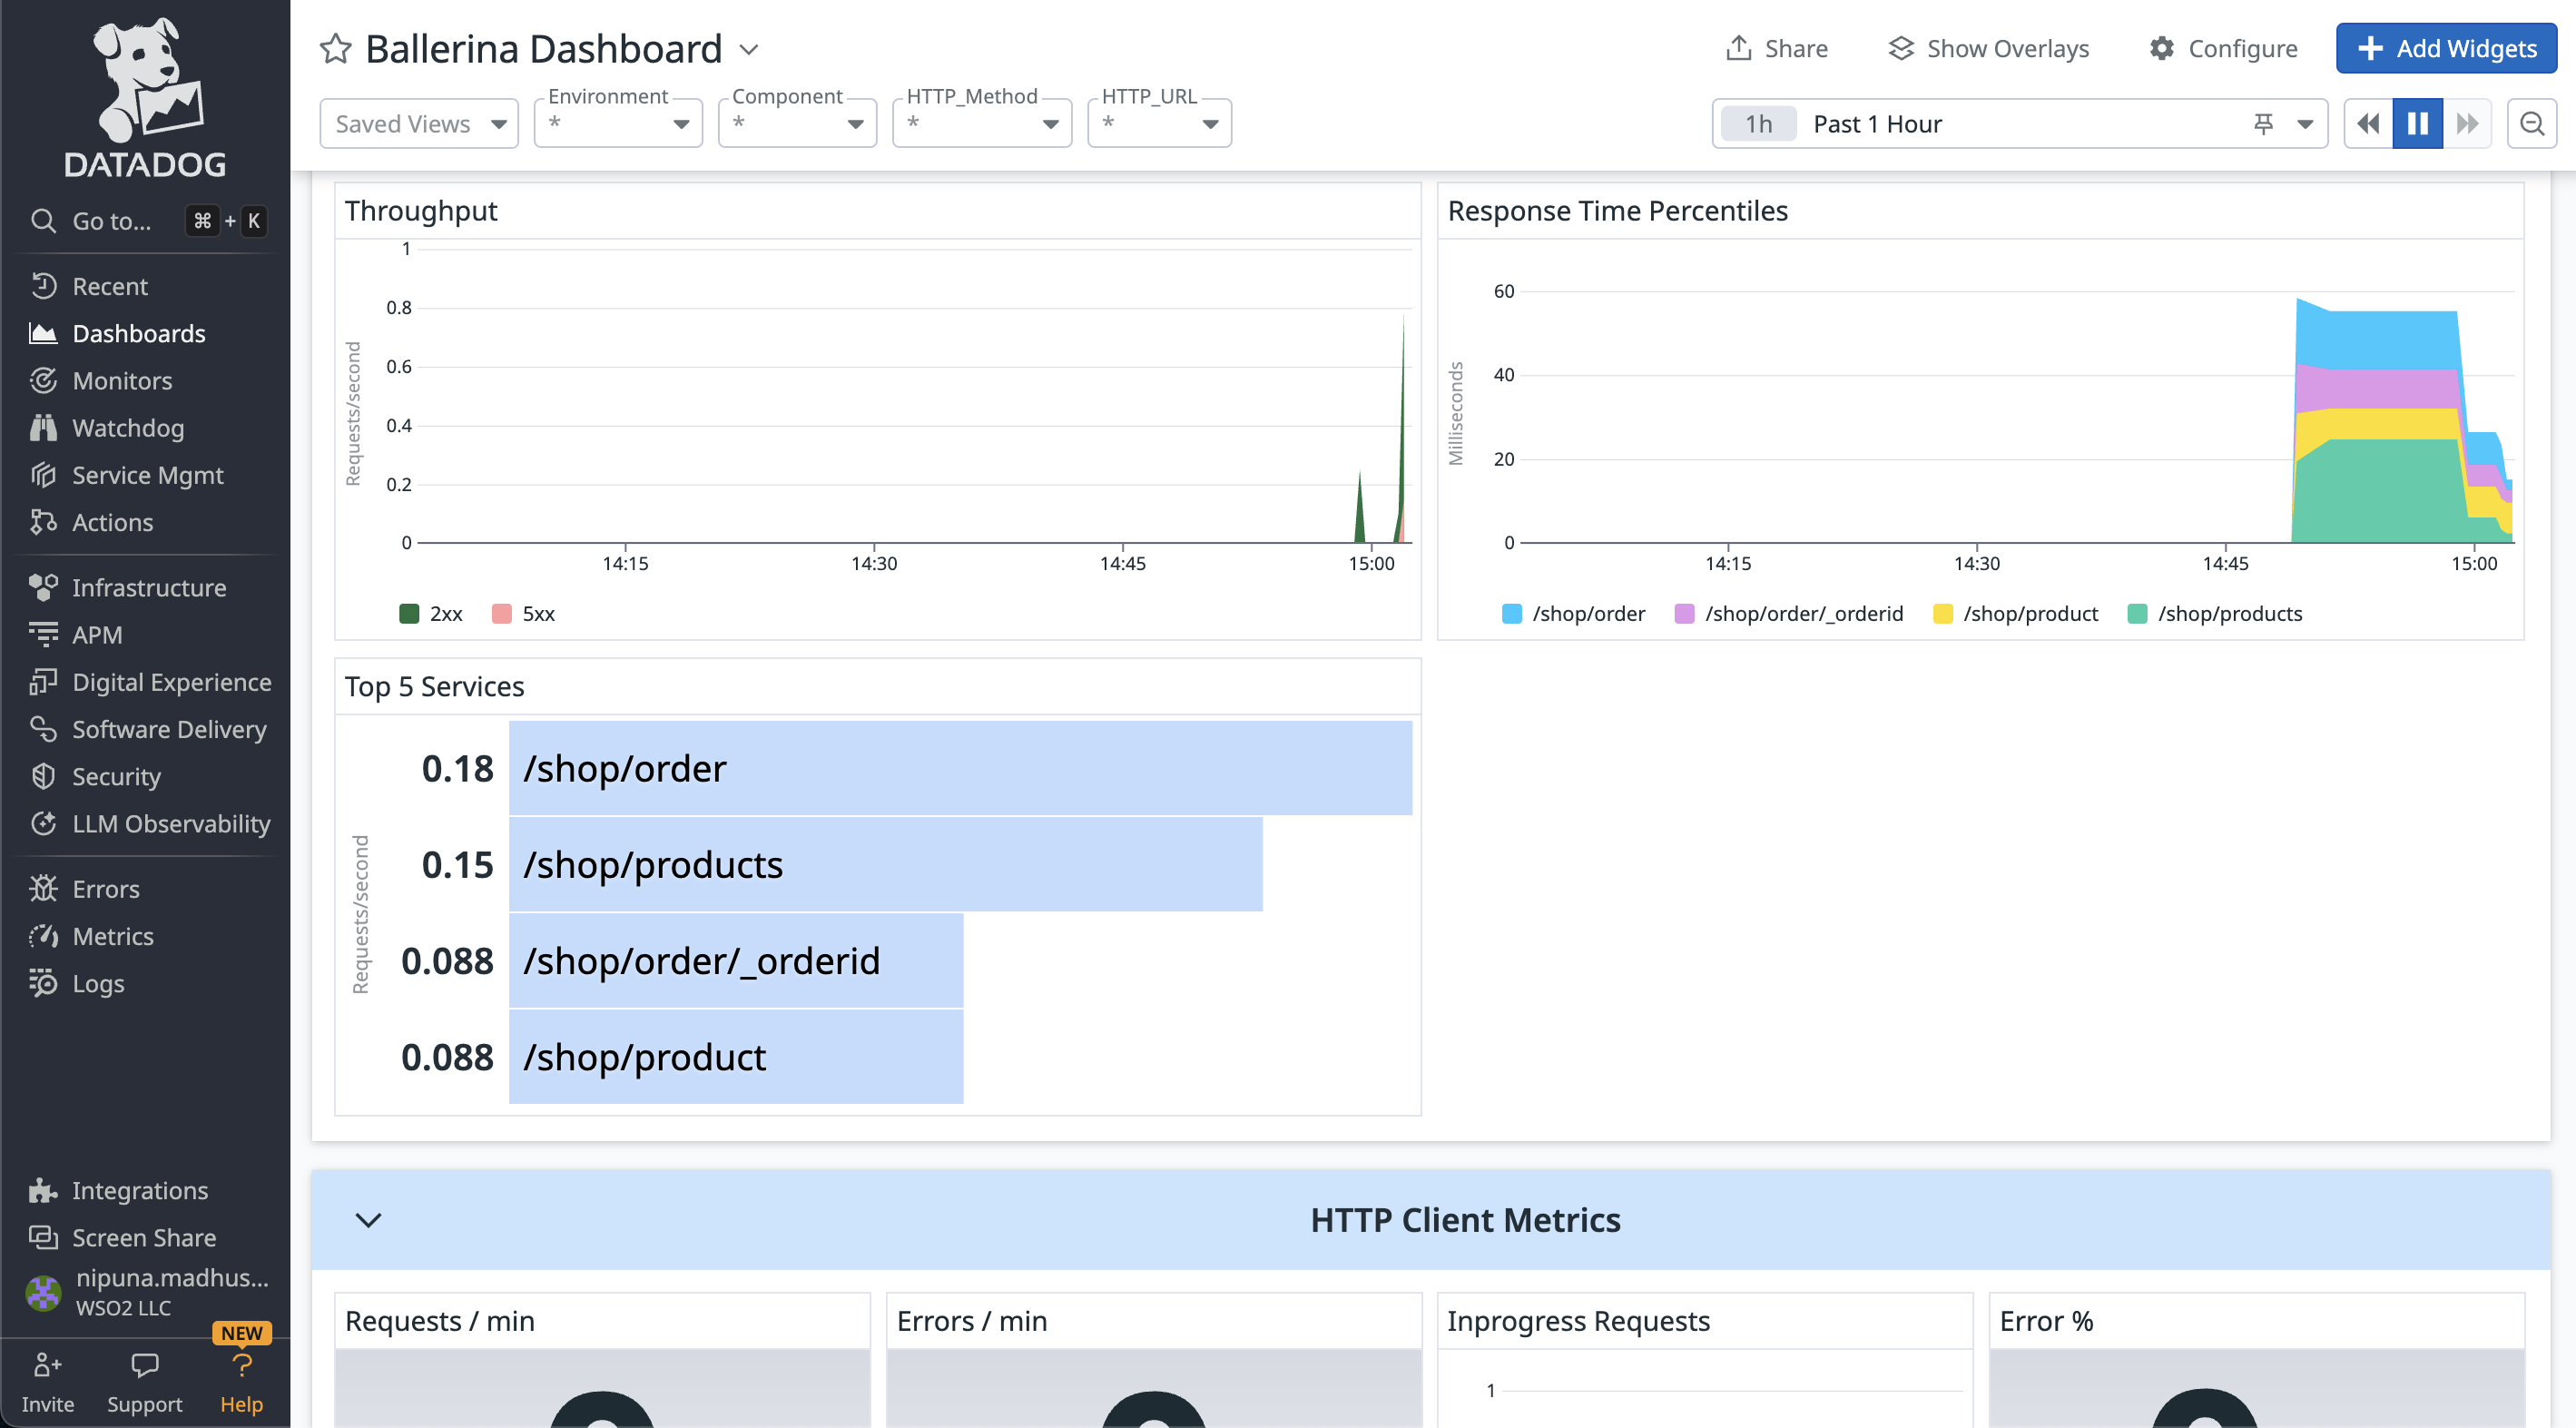
Ballerina provides a dashboard in the Datadog to observe metrics in Ballerina applications.
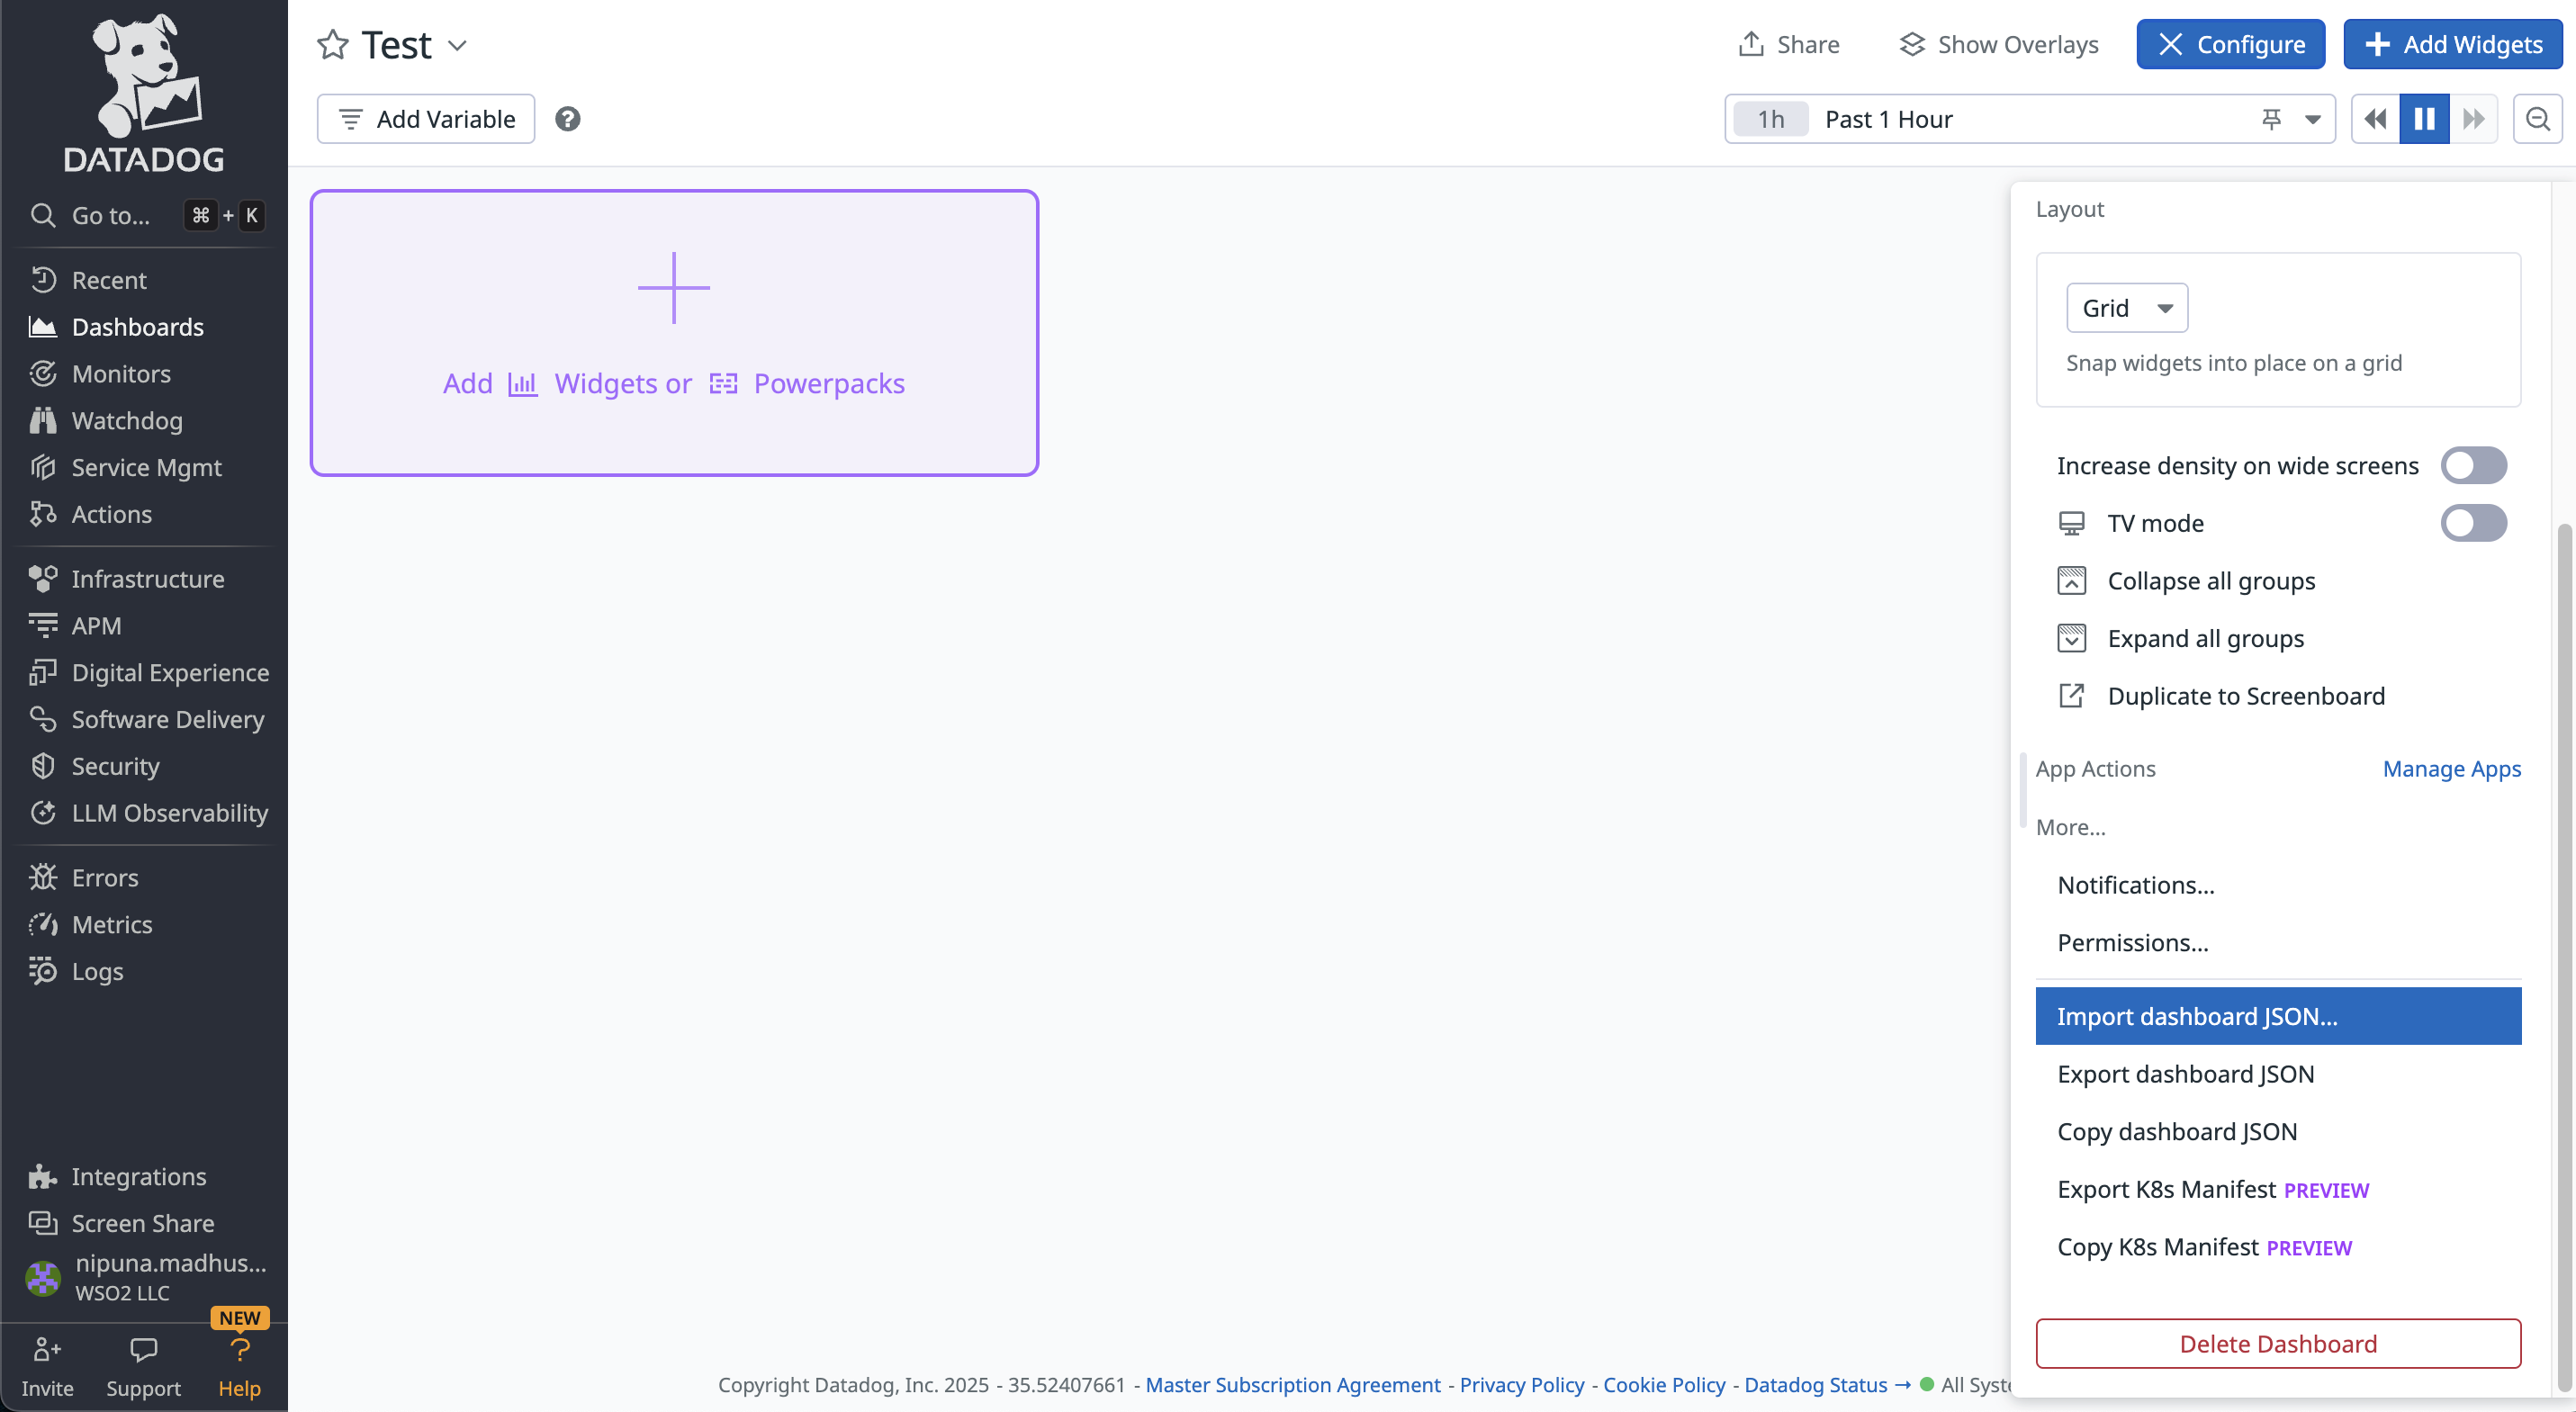
You can add a new dashboard in the Datadog under the Dashboards tab in the left navigation. After creating the new dashboard, go to the Configure tab in the dashboard. Import the dashboard.json file provided above.
The Ballerina Dashboard in the Datadog will be displayed as below.
Step 8 - View tracing on Datadog
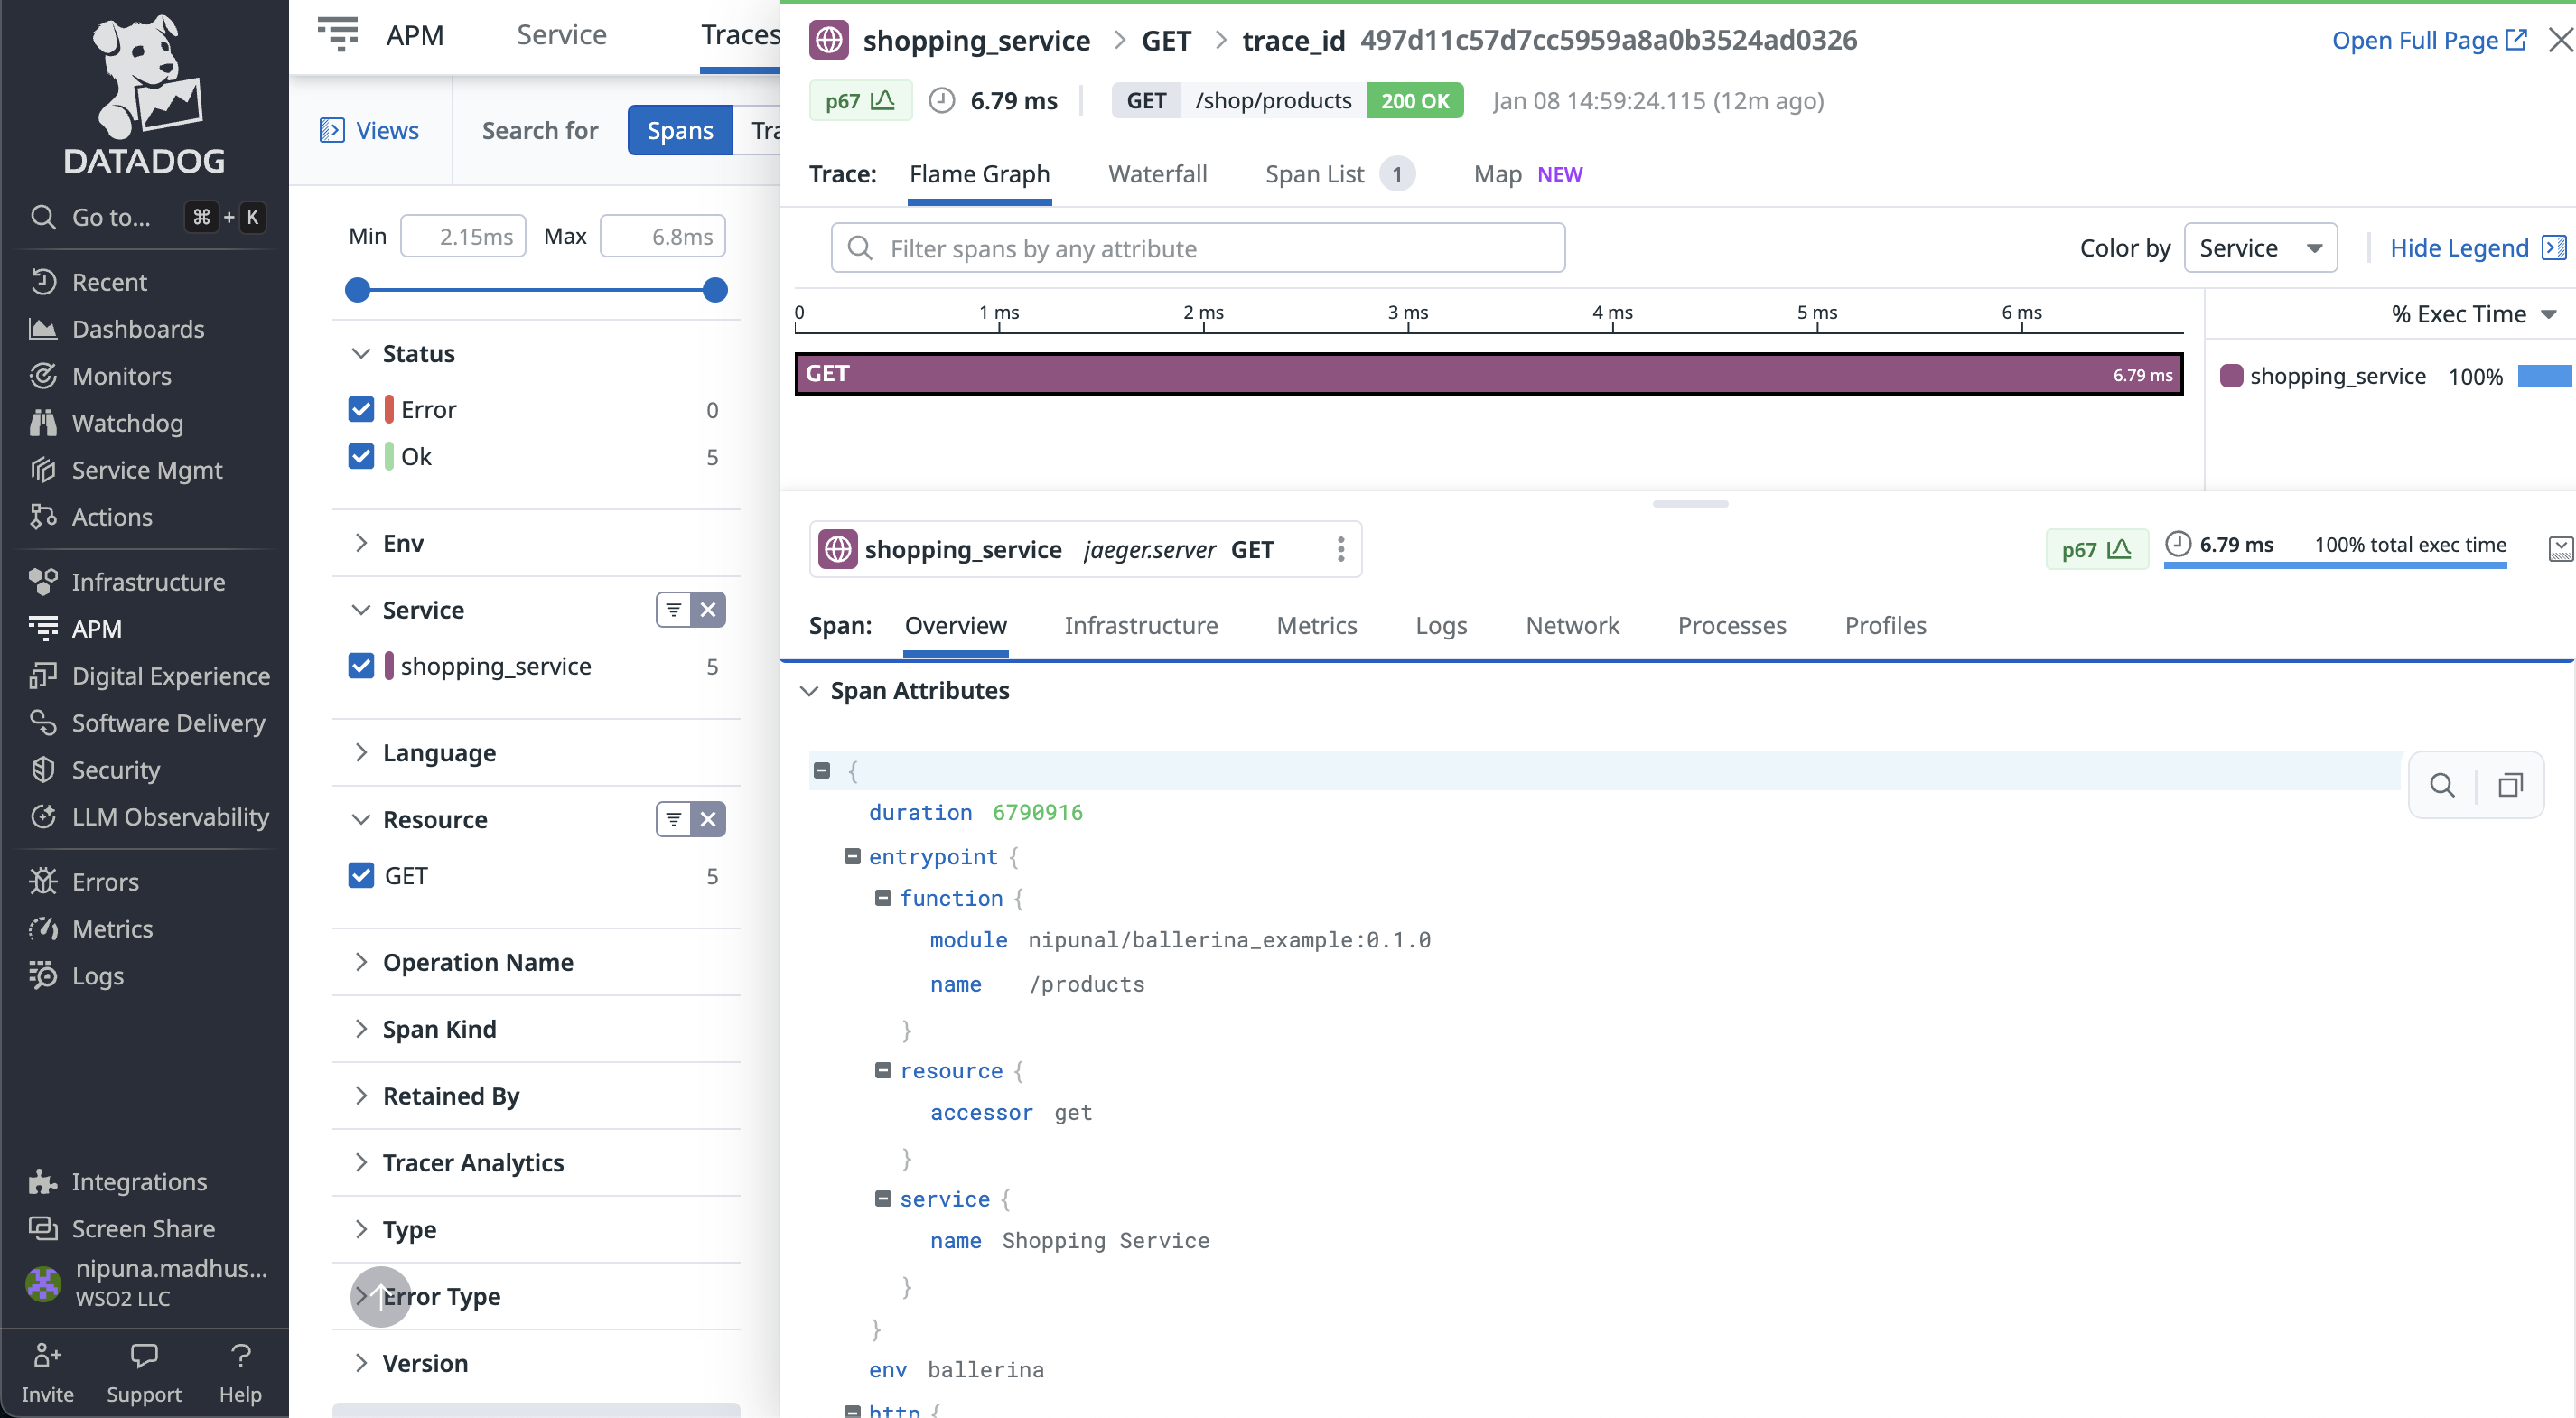
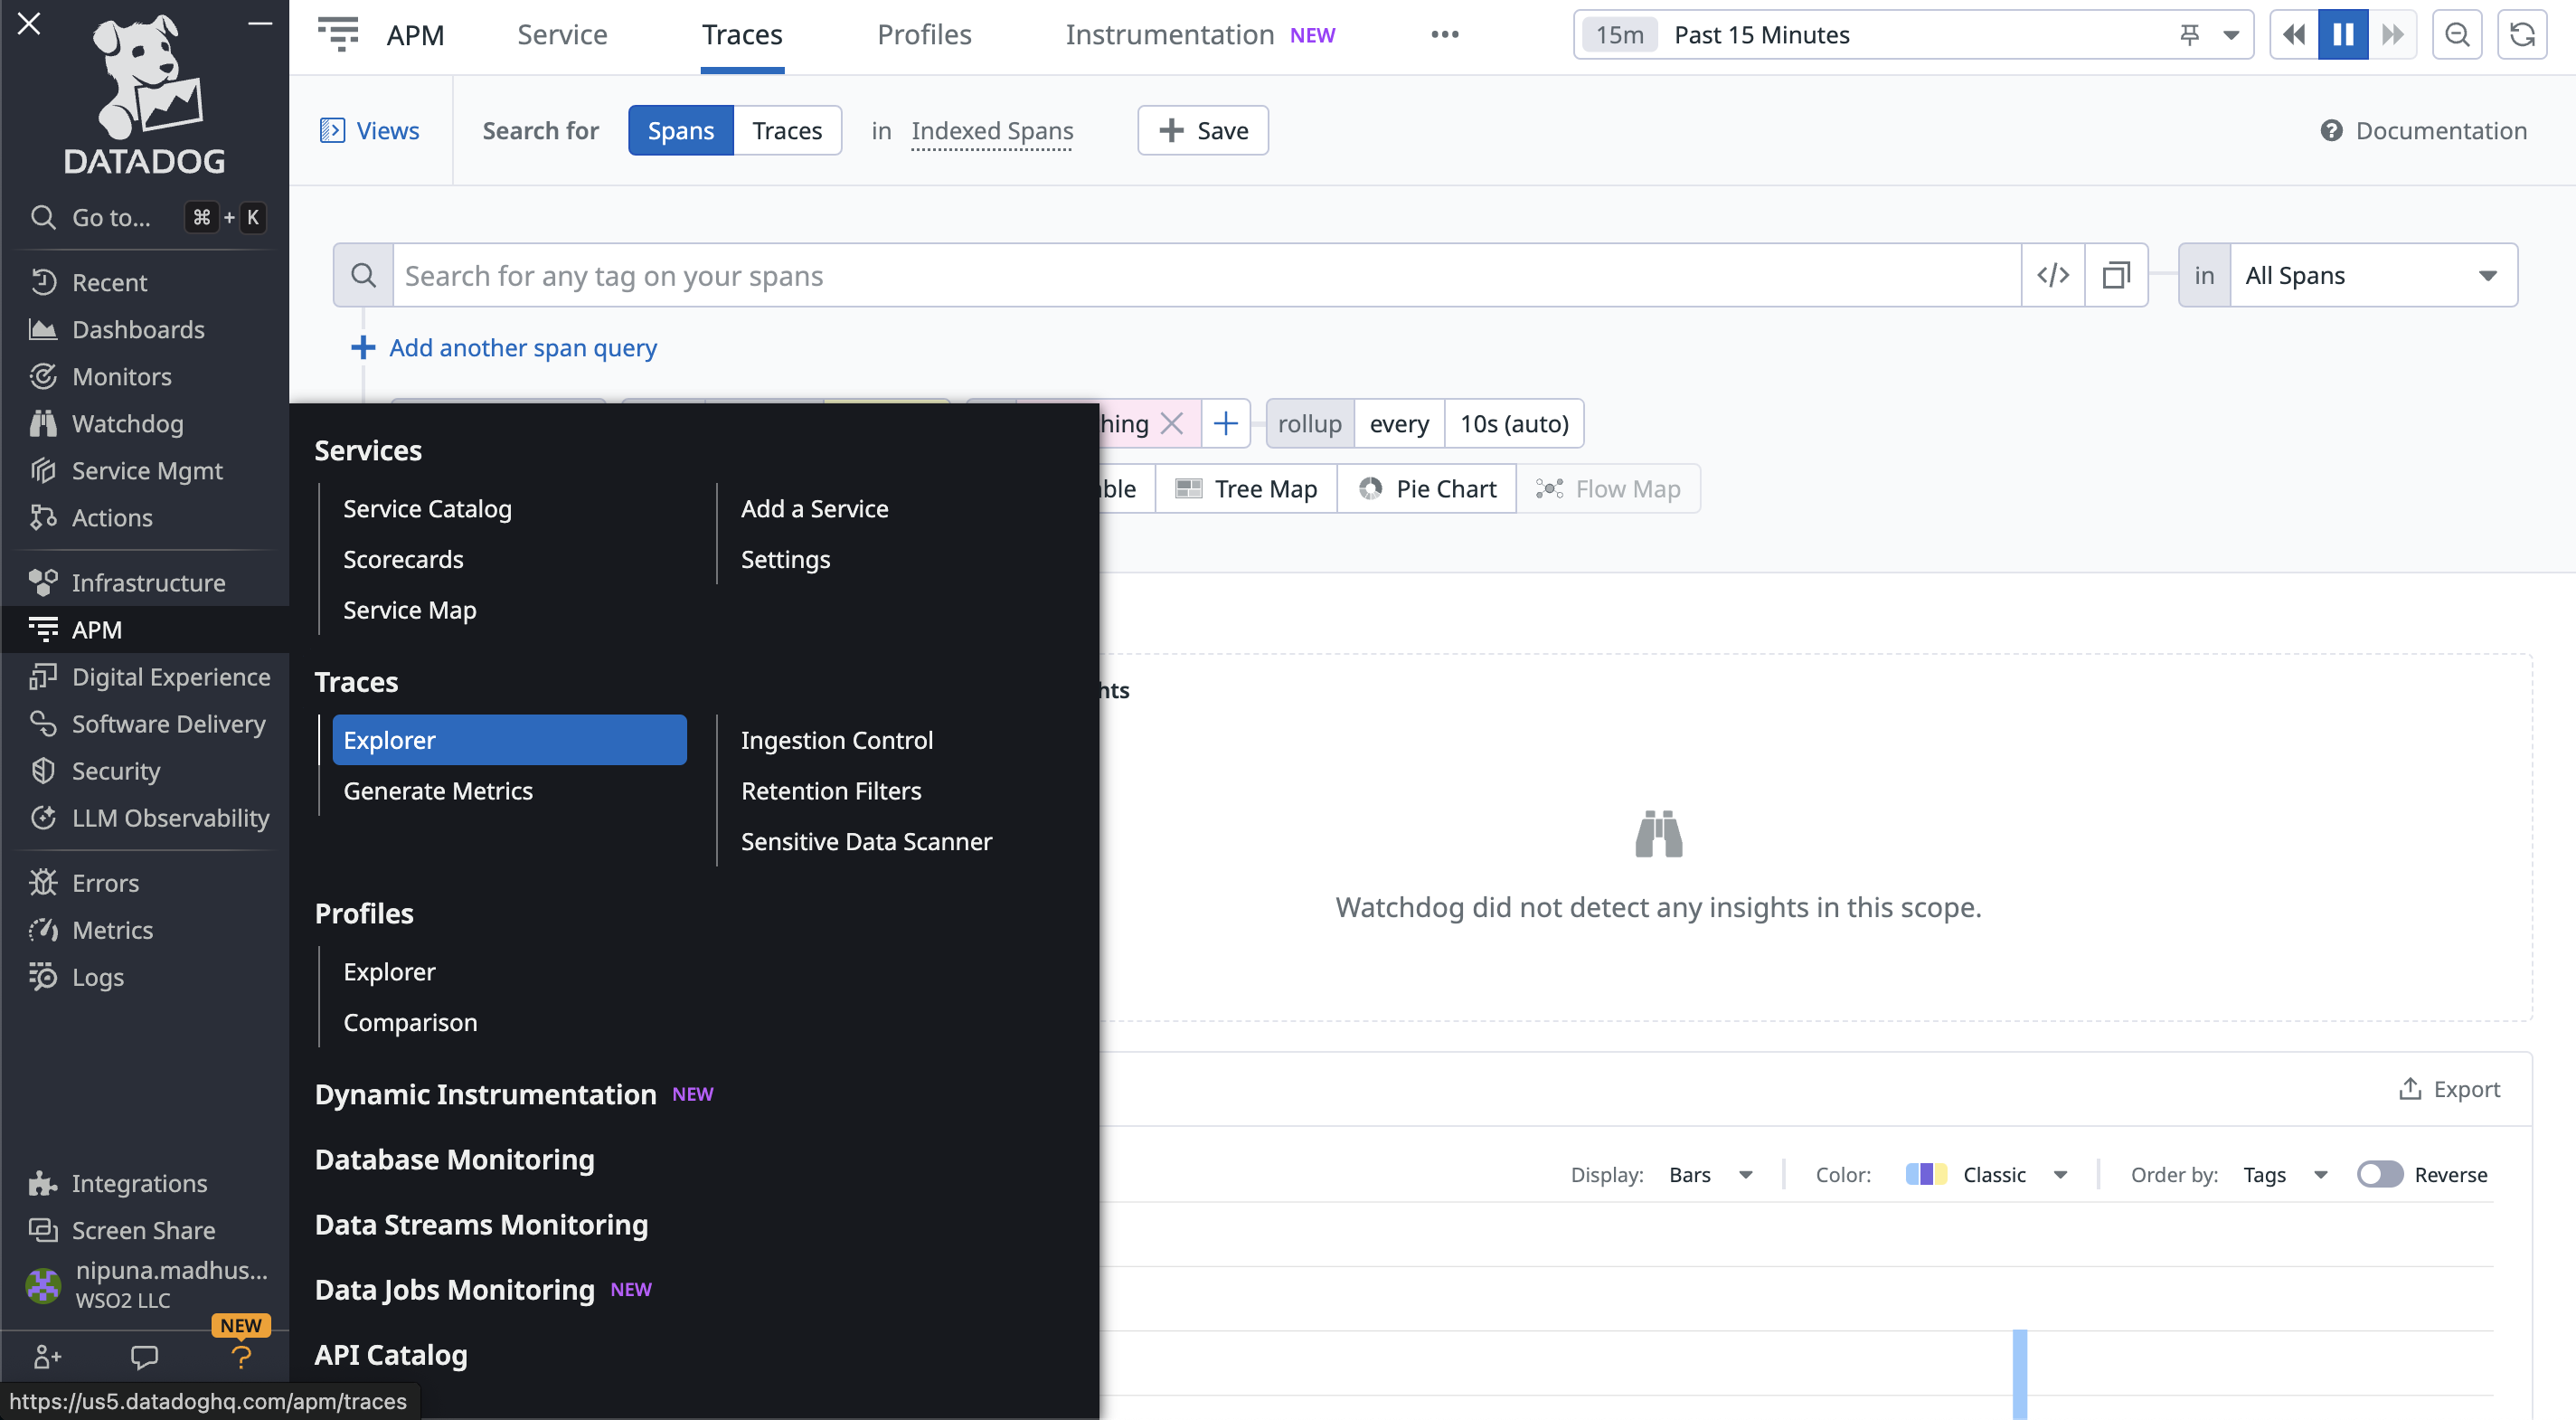
To view traces of the Ballerina application, go to APM → Traces in the Datadog.
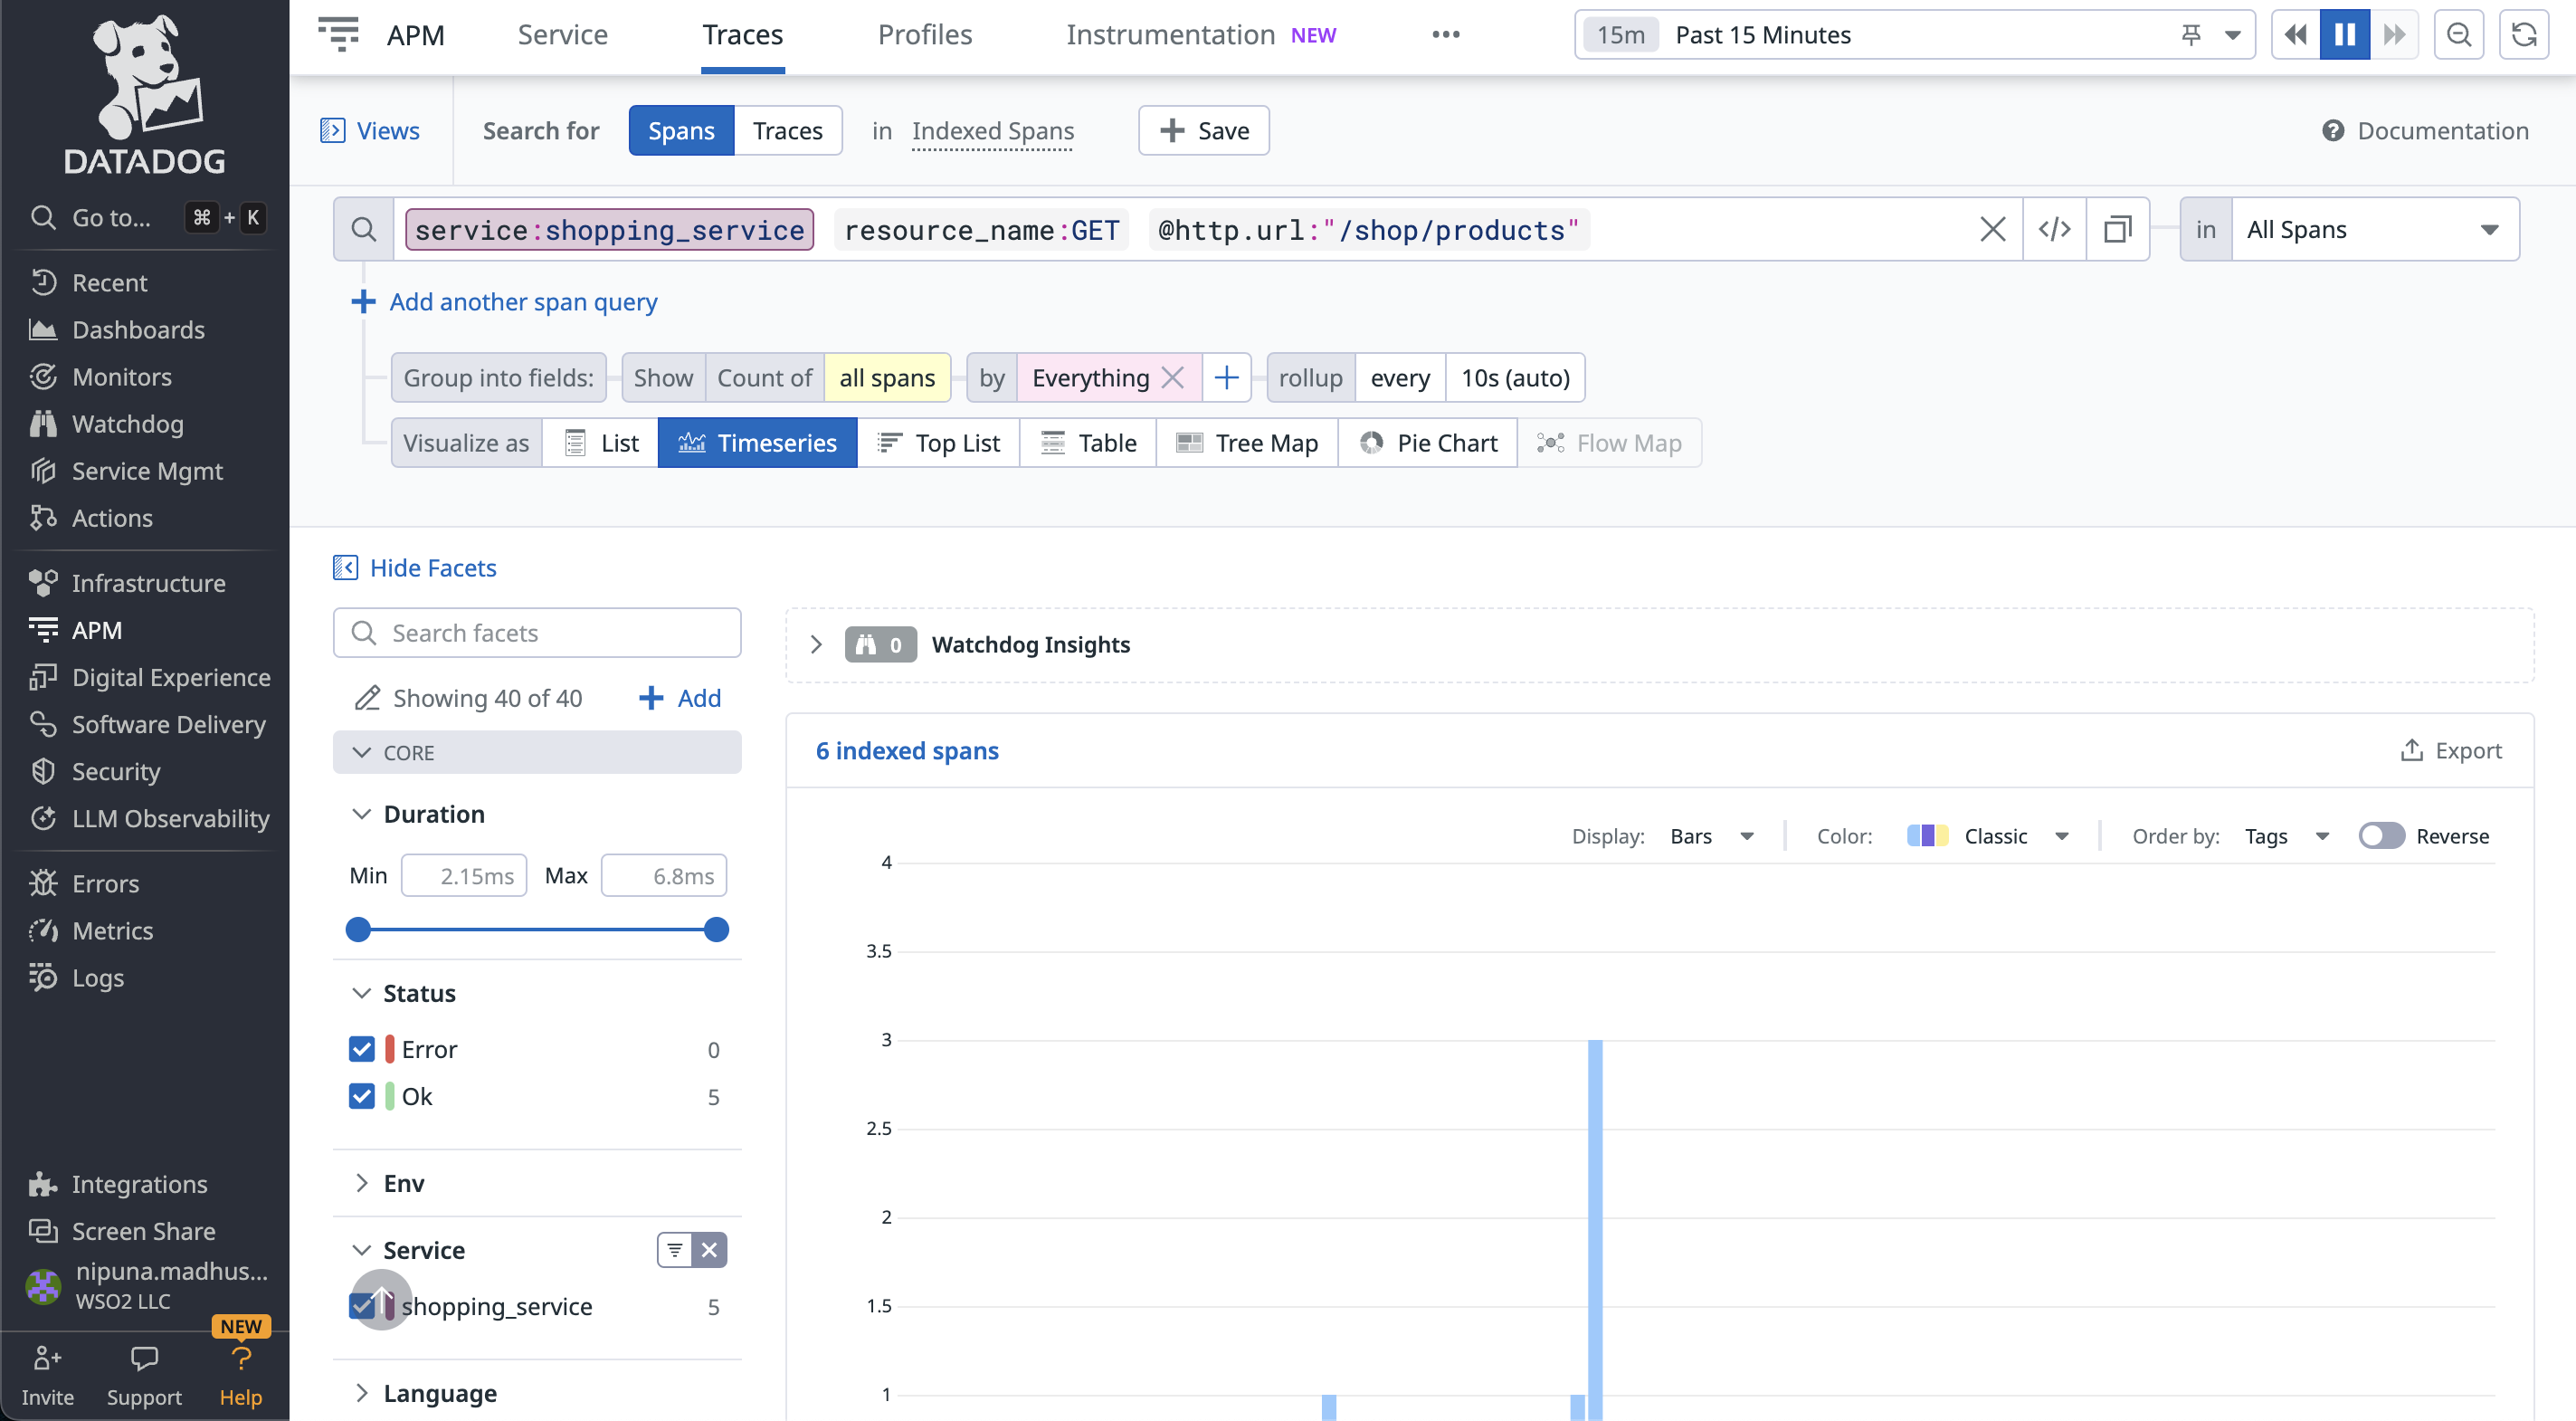
You can filter the traces with the service name, resource, operation name, span kind, etc.
Once you select a trace, you can get more information with the tags attached to the span.
