- Write a RESTful API with Ballerina
- Write a gRPC service with Ballerina
- Write a GraphQL API with Ballerina
- Work with data using queries in Ballerina
- Build a data service in Ballerina
- Build a Change Data Capture (CDC) service in Ballerina
- Work with Large Language Models (LLMs) using natural expressions
- Deploy Ballerina on Kubernetes
- Manage data persistence with bal persist
- Create your first connector with Ballerina
Users can configure Ballerina to support distributed tracing with Jaeger, which is one of the open-source and distributed tracing platforms used worldwide. Ballerina provides tracing data in OpenTelemetry format.
The sample shop service will be used in this guide. Follow the steps given below to observe Ballerina tracing in Jaeger.
Step 1 - Set up Jaeger
You can configure Ballerina to support distributed tracing with Jaeger. This section focuses on configuring Jaeger with Docker as a quick installation.
Tip: There are many possible ways to deploy Jaeger. For more information, see Jaeger Deployment. The easiest option is to use executable binaries listed in Downloads.
Install Jaeger via Docker and start the Docker container by executing the command below.
$ docker run -d -p 13133:13133 -p 16686:16686 -p 4317:4317 jaegertracing/opentelemetry-all-in-one
Step 2 - Import Ballerina Jaeger extension
To include the Jaeger extension into the executable, the ballerinax/jaeger module needs to be imported into your Ballerina project main.bal file.
import ballerinax/jaeger as _;
Jaeger extension has an Opentelemetry GRPC Span Exporter which will push tracing data as batches to the Jaeger server endpoint (default - http://localhost:4317) in opentelemetry format.
Step 3 - Configure Ballerina runtime configurations
Tracing can be enabled in your Ballerina project using configurations similar to the following in your Config.toml file.
[ballerina.observe] tracingEnabled=true tracingProvider="jaeger" [ballerinax.jaeger] agentHostname="localhost" agentPort=4317 samplerType="const" samplerParam=1.0 reporterFlushInterval=2000 reporterBufferSize=1000
The table below provides the descriptions of each configuration option and possible values that can be assigned.
| Configuration key | Description | Default value | Possible values |
|---|---|---|---|
| ballerinax.jaeger. agentHostname | Hostname of the Jaeger agent | localhost | IP or hostname of the Jaeger agent. If it is running on the same node as Ballerina, it can be localhost. |
| ballerinax.jaeger. agentPort | Port of the Jaeger agent | 4317 | The port on which the Jaeger agent is listening. |
| ballerinax.jaeger. samplerType | Type of the sampling methods used in the Jaeger tracer. | const | const, probabilistic, or ratelimiting. |
| ballerinax.jaeger. samplerParam | It is a floating value. Based on the sampler type, the effect of the sampler param varies | 1.0 | For const 0 (no sampling) or 1 (sample all spans), for probabilistic 0.0 to 1.0, for ratelimiting any positive integer (rate per second). |
| ballerinax.jaeger. reporterFlushInterval | The Jaeger client will be sending the spans to the agent at this interval. | 2000 | Any positive integer value. |
| ballerinax.jaeger. reporterBufferSize | Queue size of the Jaeger client. | 1000 | Any positive integer value. |
Step 4 - Run the Ballerina service
When Ballerina observability is enabled, the Ballerina runtime collects tracing data and traces will be published to Jaeger.
Run the following command to start the Ballerina service.
$ bal run Compiling source Running executable ballerina: started publishing traces to Jaeger on localhost:4317
Step 5 - Send requests
Send requests to http://localhost:8090/shop/products.
Example cURL commands:
$ curl -X GET http://localhost:8090/shop/products
$ curl -X POST http://localhost:8090/shop/product \ -H "Content-Type: application/json" \ -d '{ "id": 4, "name": "Laptop Charger", "price": 50.00 }'
$ curl -X POST http://localhost:8090/shop/order \ -H "Content-Type: application/json" \ -d '{ "productId": 1, "quantity": 1 }'
$ curl -X GET http://localhost:8090/shop/order/0
Step 6 - View distributed tracing on the Jaeger server
Go to http://localhost:16686 and load the web UI of Jaeger to make sure it is functioning properly. You can select the service for which you need tracing information find traces.
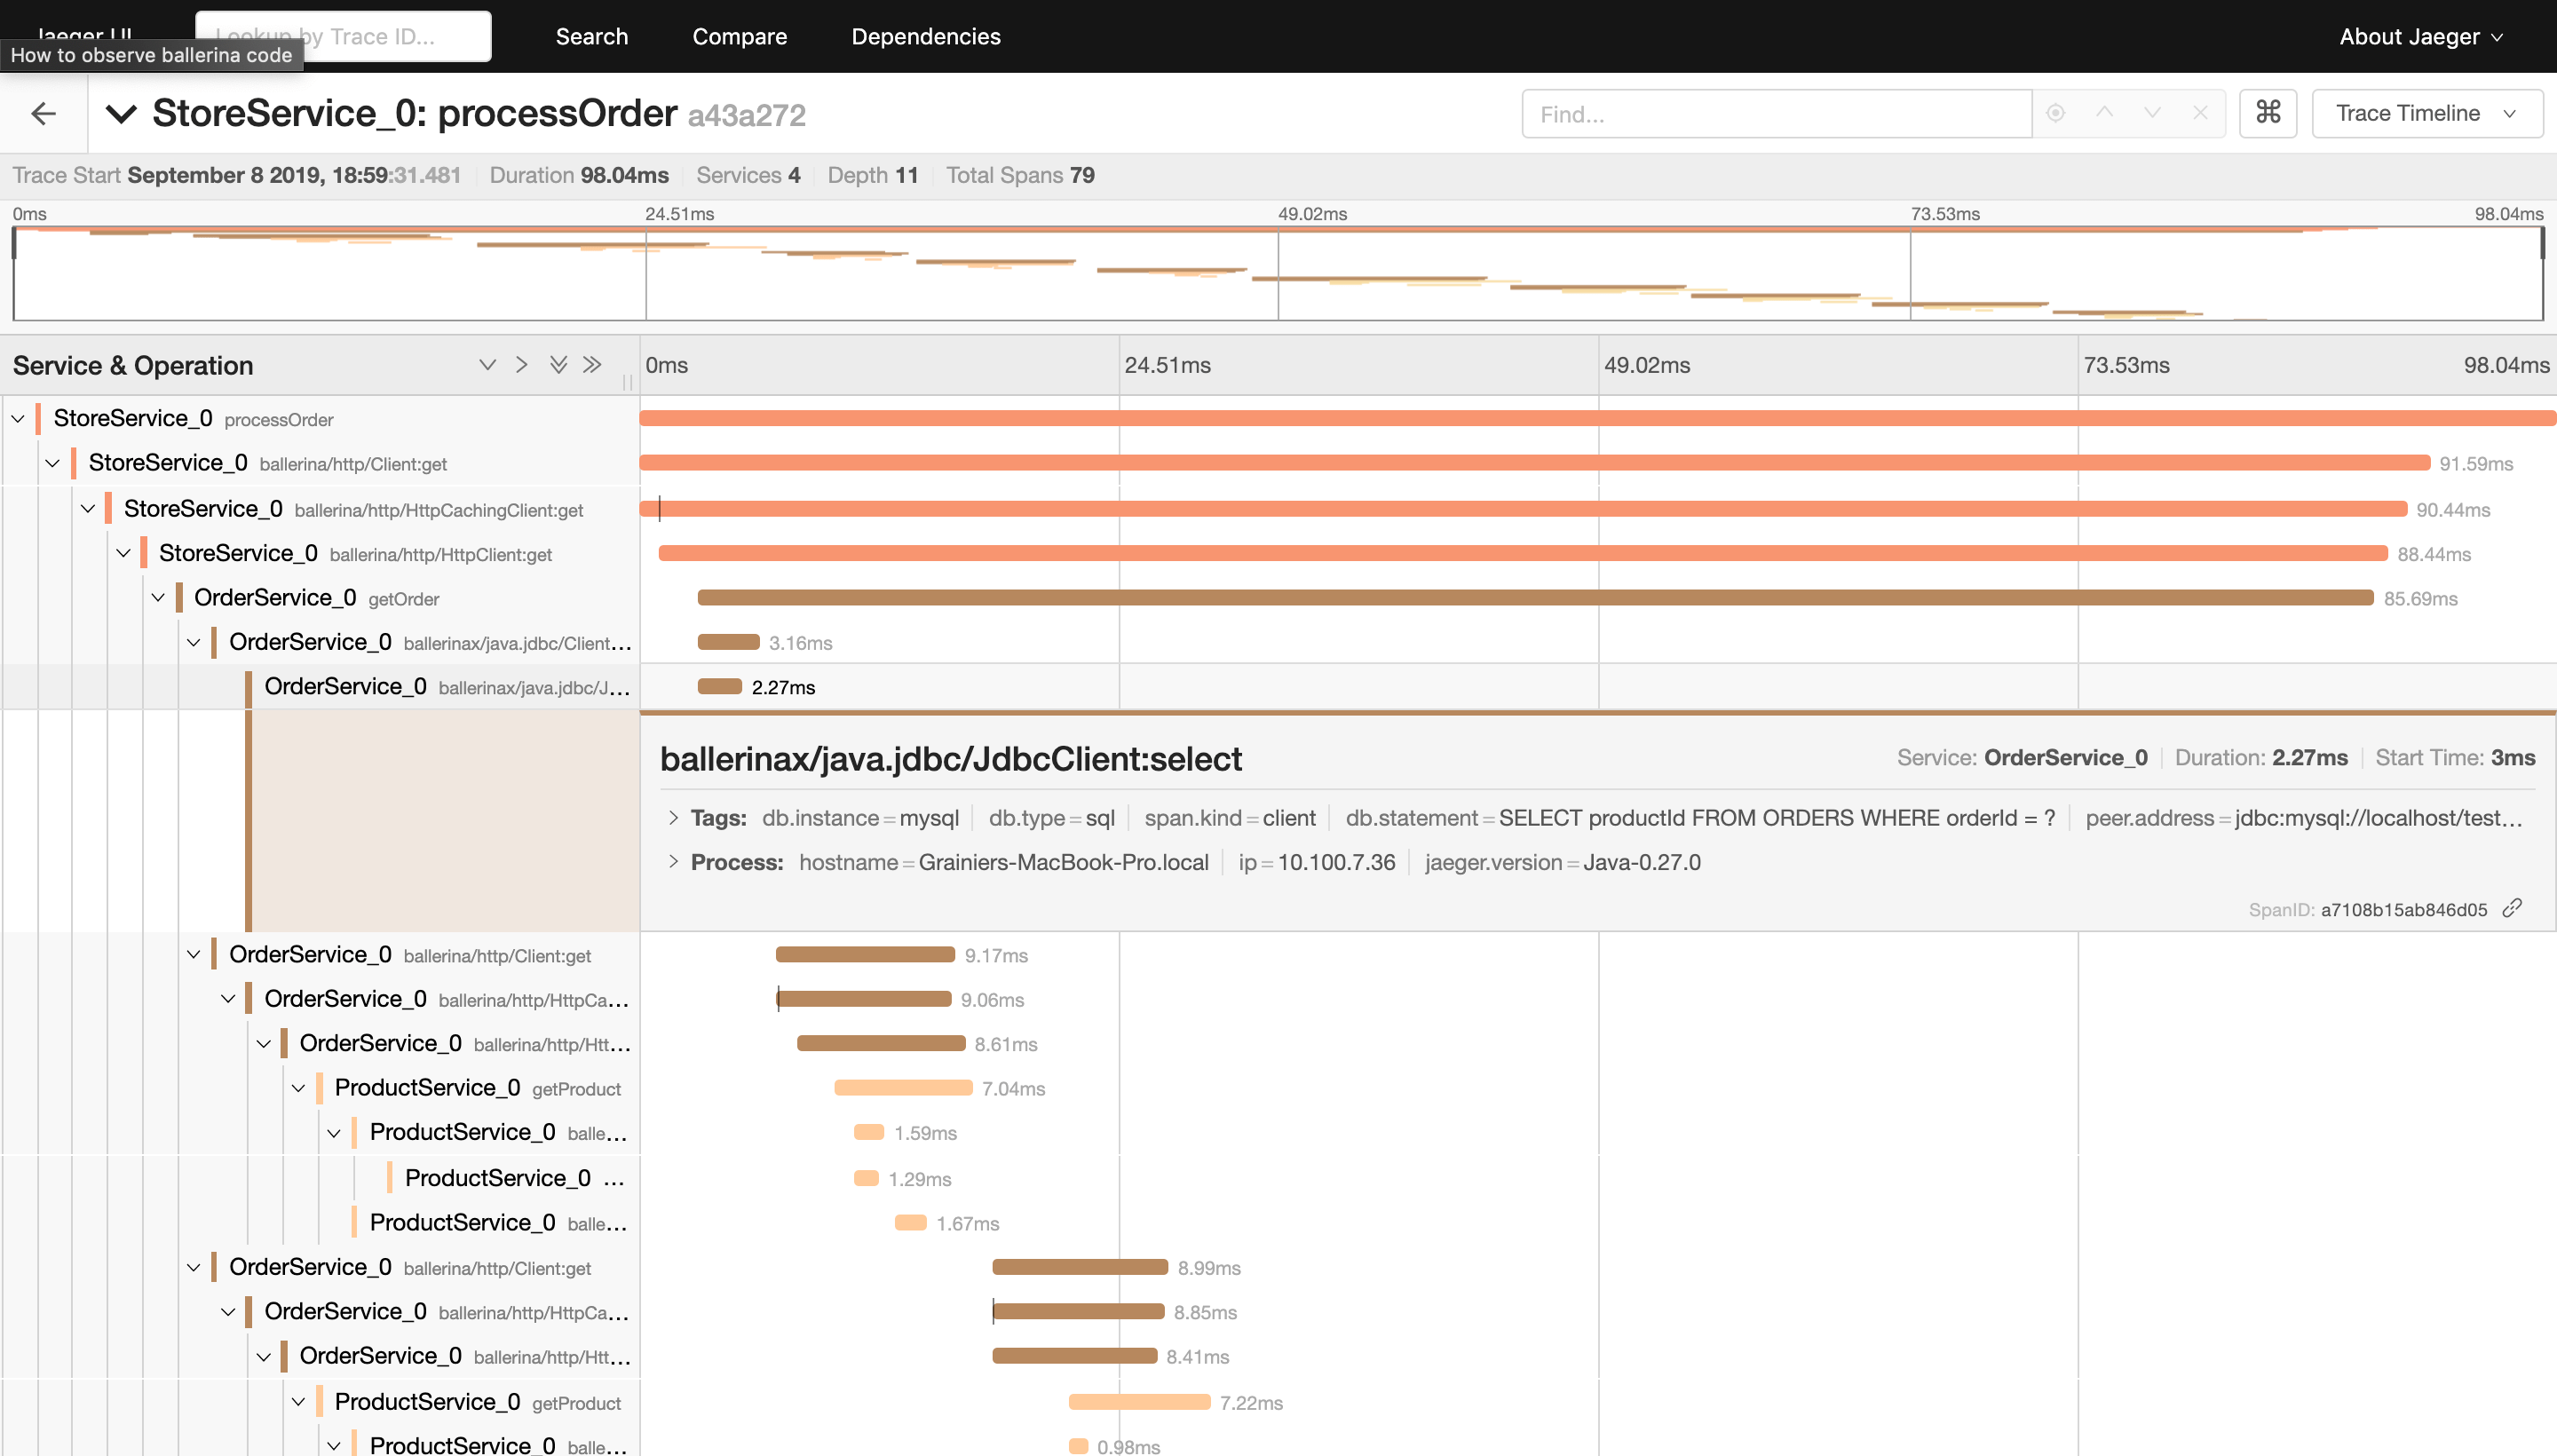
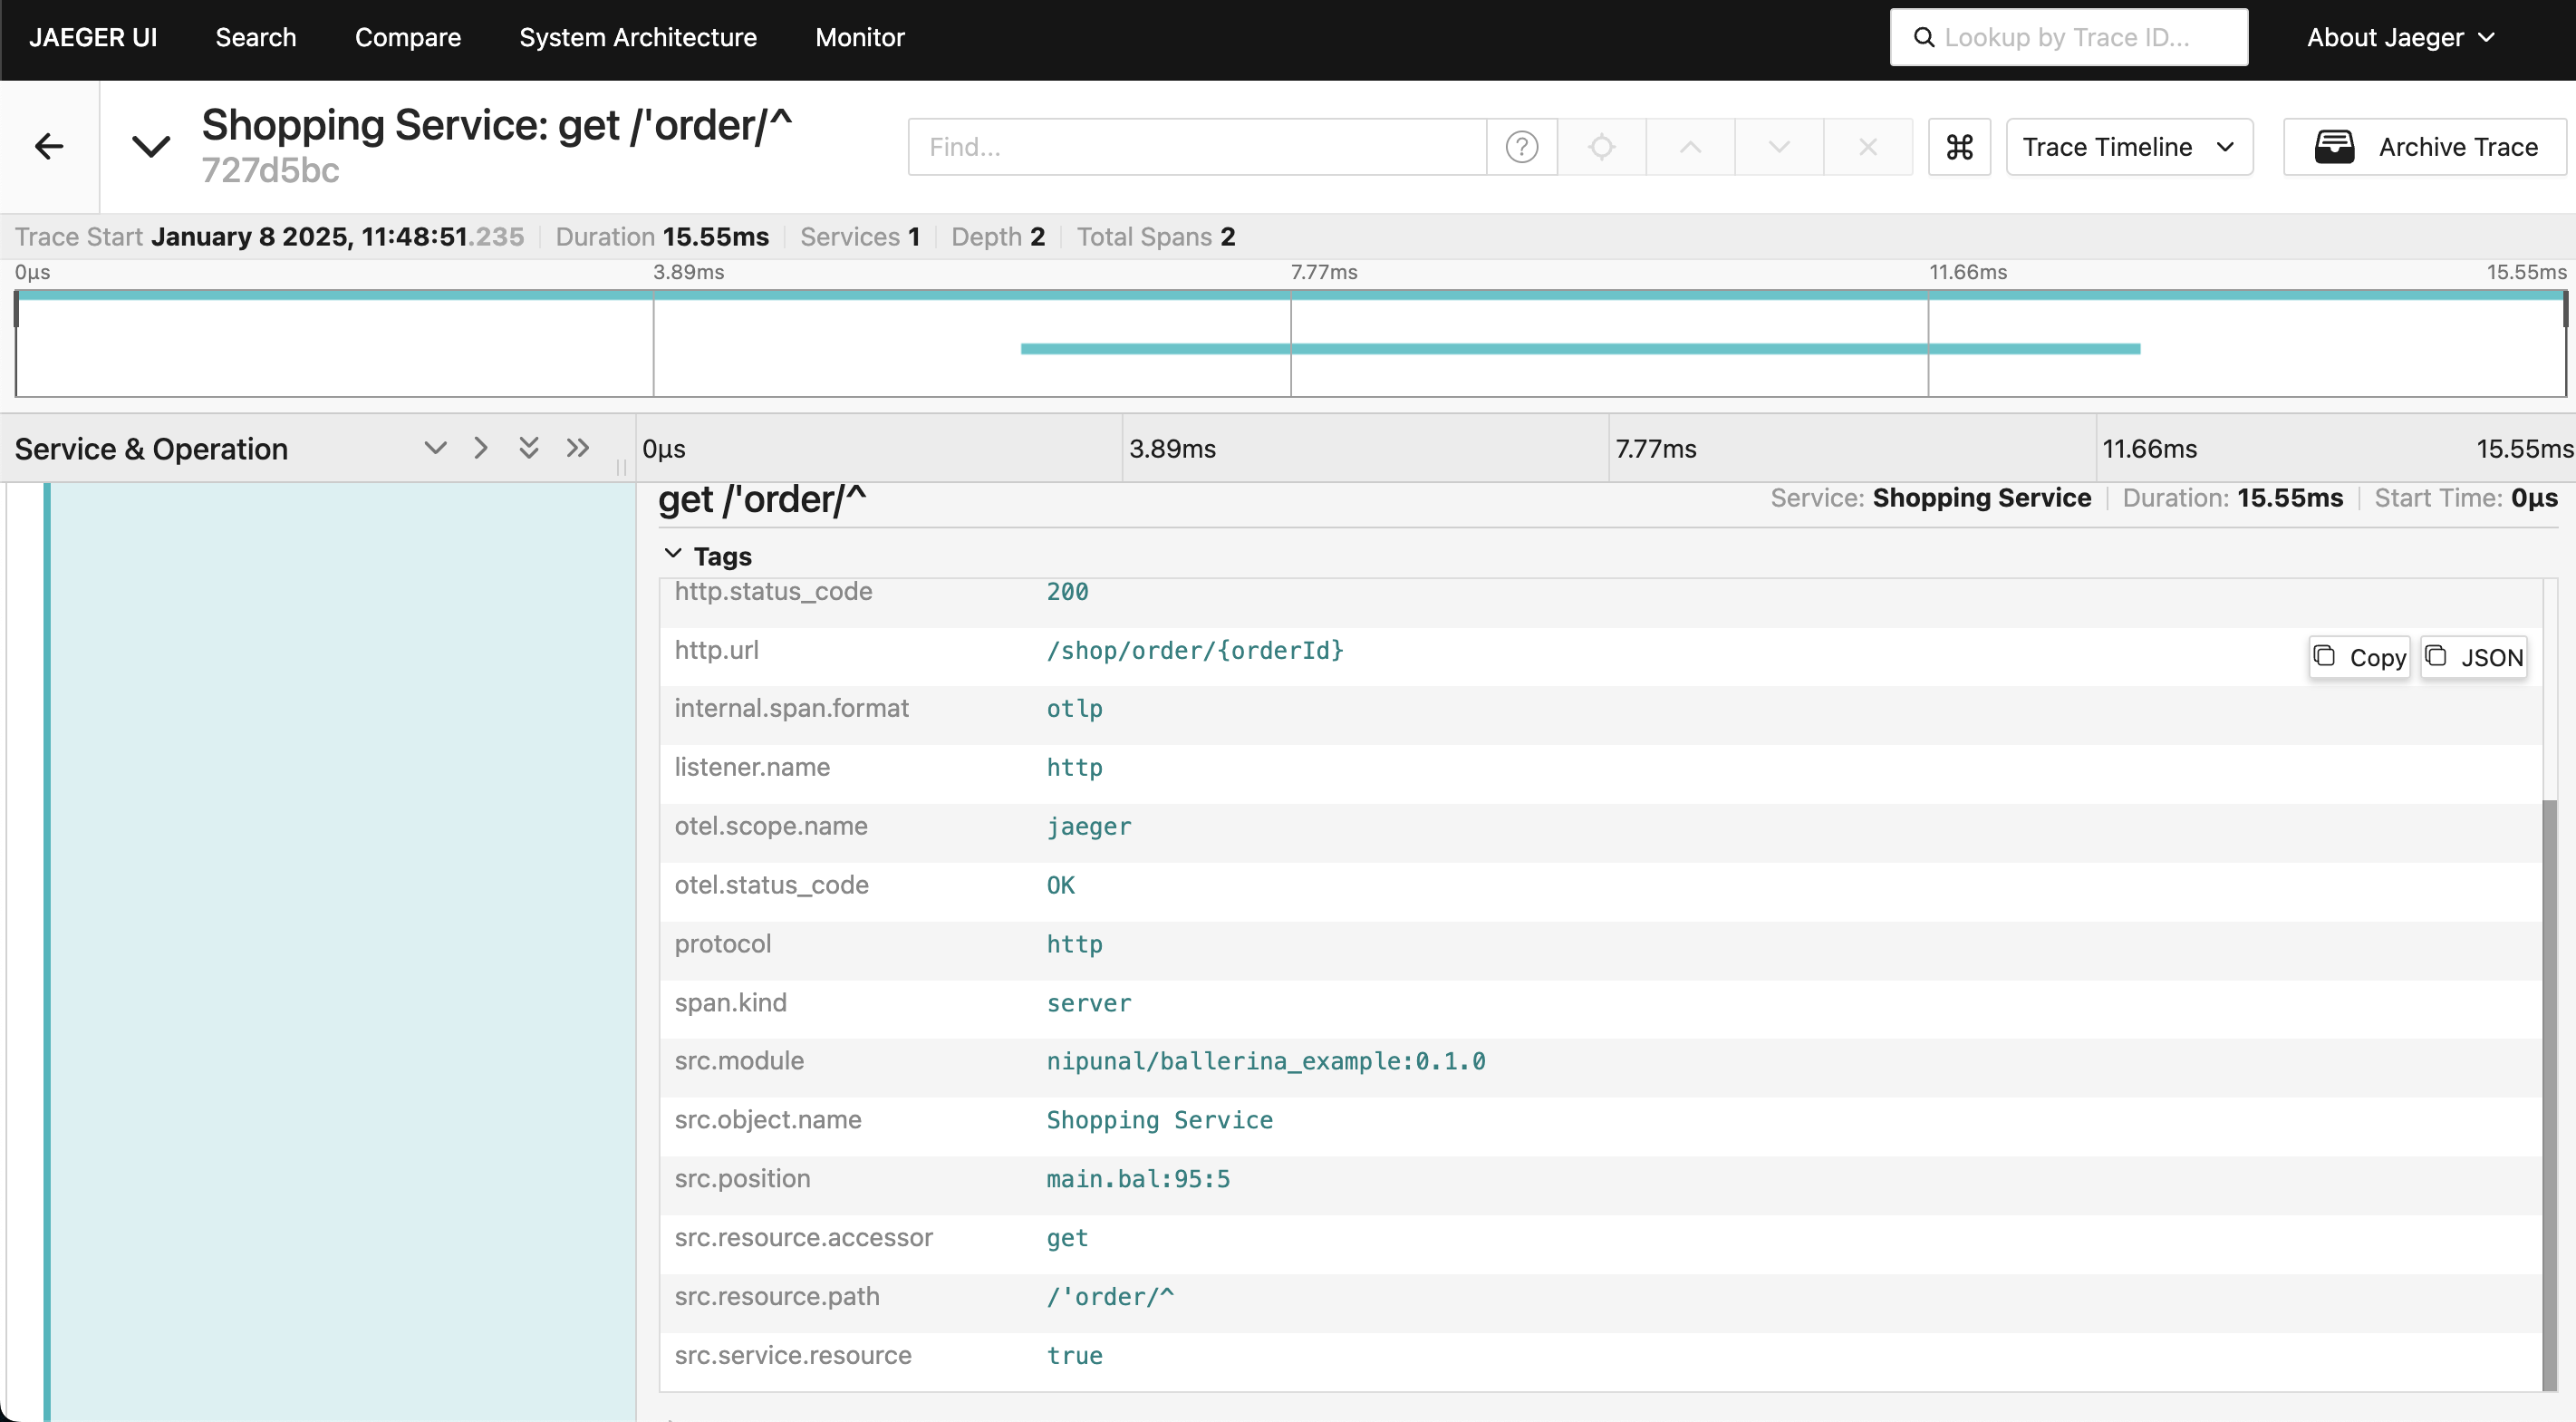
The image below is the sample tracing information you can see in Jaeger.

