- Write a RESTful API with Ballerina
- Write a gRPC service with Ballerina
- Write a GraphQL API with Ballerina
- Work with data using queries in Ballerina
- Build a data service in Ballerina
- Build a Change Data Capture (CDC) service in Ballerina
- Work with Large Language Models (LLMs) using natural expressions
- Deploy Ballerina on Kubernetes
- Manage data persistence with bal persist
- Create your first connector with Ballerina
Users can observe Ballerina programs with New Relic, which is an observability platform designed to help organizations monitor, analyze, and troubleshoot their applications, infrastructure, and digital experiences in real-time. Both metrics and tracing in Ballerina can be viewed with New Relic.
The sample shop service will be used in this guide. Follow the steps given below to observe Ballerina tracing and metrics in New Relic.
Step 1 - Create a New Relic account and an API key
Sign up and Generate an API Key in New Relic.
To configure the API key in Newrelic:
Go to Profile -> API keys -> Insights Insert key -> Insert keys to create an account in New Relic.
Step 2 - Import Ballerina New Relic extension
To include the New Relic extension into the executable, the ballerinax/newrelic module needs to be imported into your Ballerina project main.bal file.
import ballerinax/newrelic as _;
New Relic extension has an Opentelemetry GRPC Span Exporter which will push tracing data as batches to the New Relic server endpoint (https://otlp.nr-data.net:4317) in opentelemetry format.
New Relic extension pushes metrics in New Relic metric format to the New Relic server endpoint (https://metric-api.newrelic.com/metric/v1).
Step 3 - Configure Ballerina runtime configurations
Tracing and metrics can be enabled in your Ballerina project using configurations similar to the following in your Config.toml file.
[ballerina.observe] tracingEnabled=true tracingProvider="newrelic" metricsEnabled=true metricsReporter="newrelic" [ballerinax.newrelic] apiKey="<NEW_RELIC_LICENSE_KEY>" # Mandatory Configuration. tracingSamplerType="const" # Optional Configuration. Default value is 'const' tracingSamplerParam=1 # Optional Configuration. Default value is 1 tracingReporterFlushInterval=15000 # Optional Configuration. Default value is 15000 milliseconds tracingReporterBufferSize=10000 # Optional Configuration. Default value is 10000 metricReporterFlushInterval=15000 # Optional Configuration. Default value is 15000 milliseconds metricReporterClientTimeout=10000 # Optional Configuration. Default value is 10000 milliseconds isTraceLoggingEnabled=false # Optional Configuration. Default value is false isPayloadLoggingEnabled=false # Optional Configuration. Default value is false [ballerinax.newrelic.additionalAttributes] # Optional Configuration. Add custom attributes (key & value pair) to metrics key1 = "<VALUE_1>" key2 = "<VALUE_2>"
Users can also configure multiple API keys for different New Relic user accounts as given below.
[ballerinax.newrelic] apiKey=["<NEW_RELIC_LICENSE_KEY_1>", "<NEW_RELIC_LICENSE_KEY_2>"]
Tip: User can configure the environment variable
BALLERINA_NEW_RELIC_API_KEYinstead of apiKey inConfig.toml. If both are configured, apiKey inConfig.tomlwill be overwritten by the environment variable value. Environment variable can be configured for either a single user or multiple users.For a single user account:
- Linux/Unix:
export BALLERINA_NEW_RELIC_API_KEY="<NEW_RELIC_LICENSE_KEY>"- Windows:
set BALLERINA_NEW_RELIC_API_KEY="<NEW_RELIC_LICENSE_KEY>"For multiple user accounts:
- Linux/Unix:
export BALLERINA_NEW_RELIC_API_KEY="<NEW_RELIC_LICENSE_KEY_1>,<NEW_RELIC_LICENSE_KEY_2>"- Windows:
set BALLERINA_NEW_RELIC_API_KEY="<NEW_RELIC_LICENSE_KEY_1>,<NEW_RELIC_LICENSE_KEY_2>"Note: When specifying multiple API keys in the environment variable, separate each key with a comma (
,) and do not include spaces between the keys. Any leading or trailing whitespace around each key will be trimmed automatically. For example:
export BALLERINA_NEW_RELIC_API_KEY="key1,key2,key3"export BALLERINA_NEW_RELIC_API_KEY="key1, key2 , key3"(spaces will be trimmed)
The table below provides the descriptions of each configuration option and possible values that can be assigned.
| Configuration key | Description | Default value | Possible values |
|---|---|---|---|
| ballerinax.newrelic. apiKey | API key generated by the user in the New Relic platform. This configuration is mandatory. | None | |
| ballerinax.newrelic. tracingSamplerType | Type of the sampling methods used in the New Relic tracer. | const | const, probabilistic, or ratelimiting. |
| ballerinax.newrelic. tracingSamplerParam | It is a floating value. Based on the sampler type, the effect of the sampler param varies | 1.0 | For const 0 (no sampling) or 1 (sample all spans), for probabilistic 0.0 to 1.0, for ratelimiting any positive integer (rate per second). |
| ballerinax.newrelic. tracingReporterFlushInterval | The New Relic tracing client will be sending the spans to the agent at this interval. | 15000 | Any positive integer value. |
| ballerinax.newrelic. tracingReporterBufferSize | Queue size of the New Relic tracing client. | 10000 | Any positive integer value. |
| ballerinax.newrelic. metricReporterFlushInterval | The New Relic client will be sending the metrics to the agent at this interval. | 15000 | Any positive integer value. |
| ballerinax.newrelic. metricReporterClientTimeout | Queue size of the New Relic metric client. | 10000 | Any positive integer value. |
Step 4 - Run the Ballerina service
When Ballerina observability is enabled, the Ballerina runtime collects tracing and metrics data and both metrics and traces will be published to New Relic.
Run the following command to start the Ballerina service.
$ bal run Compiling source Running executable ballerina: started publishing traces to New Relic on https://otlp.nr-data.net:4317 ballerina: started publishing metrics to New Relic on https://metric-api.newrelic.com/metric/v1
Step 5 - Send requests
Send requests to http://localhost:8090/shop/products.
Example cURL commands:
$ curl -X GET http://localhost:8090/shop/products
$ curl -X POST http://localhost:8090/shop/product \ -H "Content-Type: application/json" \ -d '{ "id": 4, "name": "Laptop Charger", "price": 50.00 }'
$ curl -X POST http://localhost:8090/shop/order \ -H "Content-Type: application/json" \ -d '{ "productId": 1, "quantity": 1 }'
$ curl -X GET http://localhost:8090/shop/order/0
Step 6 - View metrics on the New Relic platform
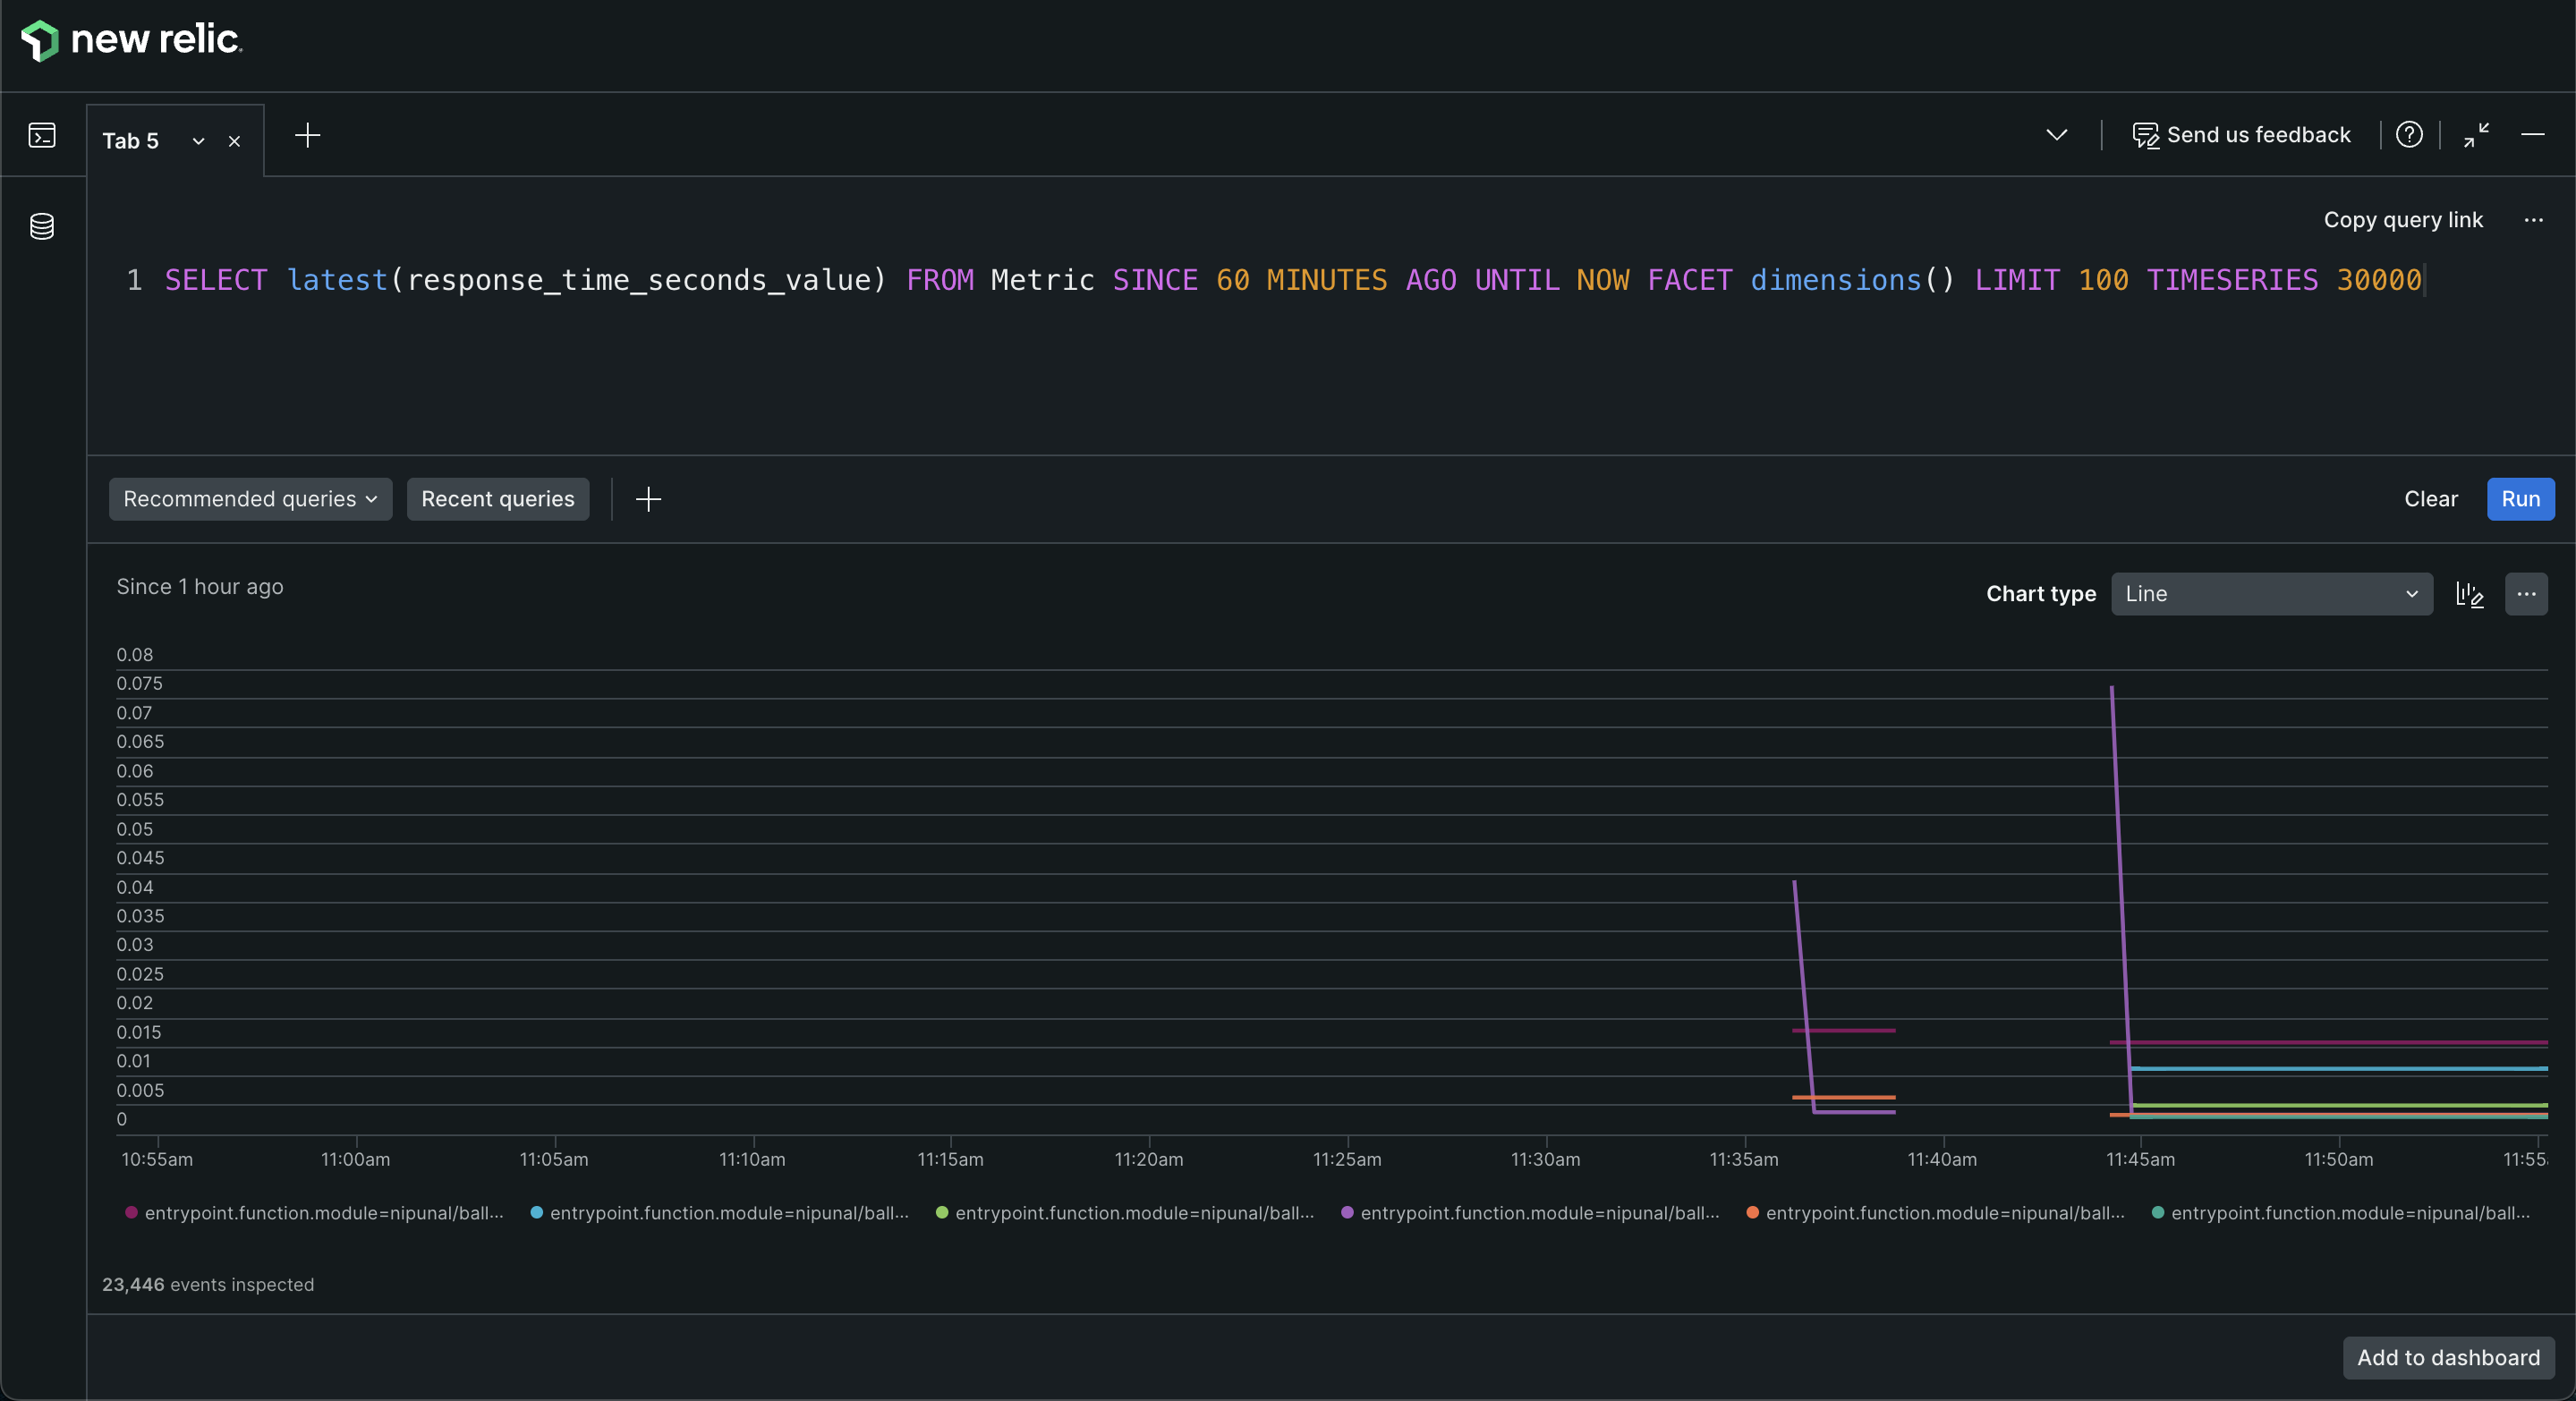
You can view the metrics that were published to the New Relic platform in the New Relic query builder. You can view the metrics query data in graphical format, as shown below.

You can create a dashboard from the metrics provided by Ballerina in the New Relic platform.
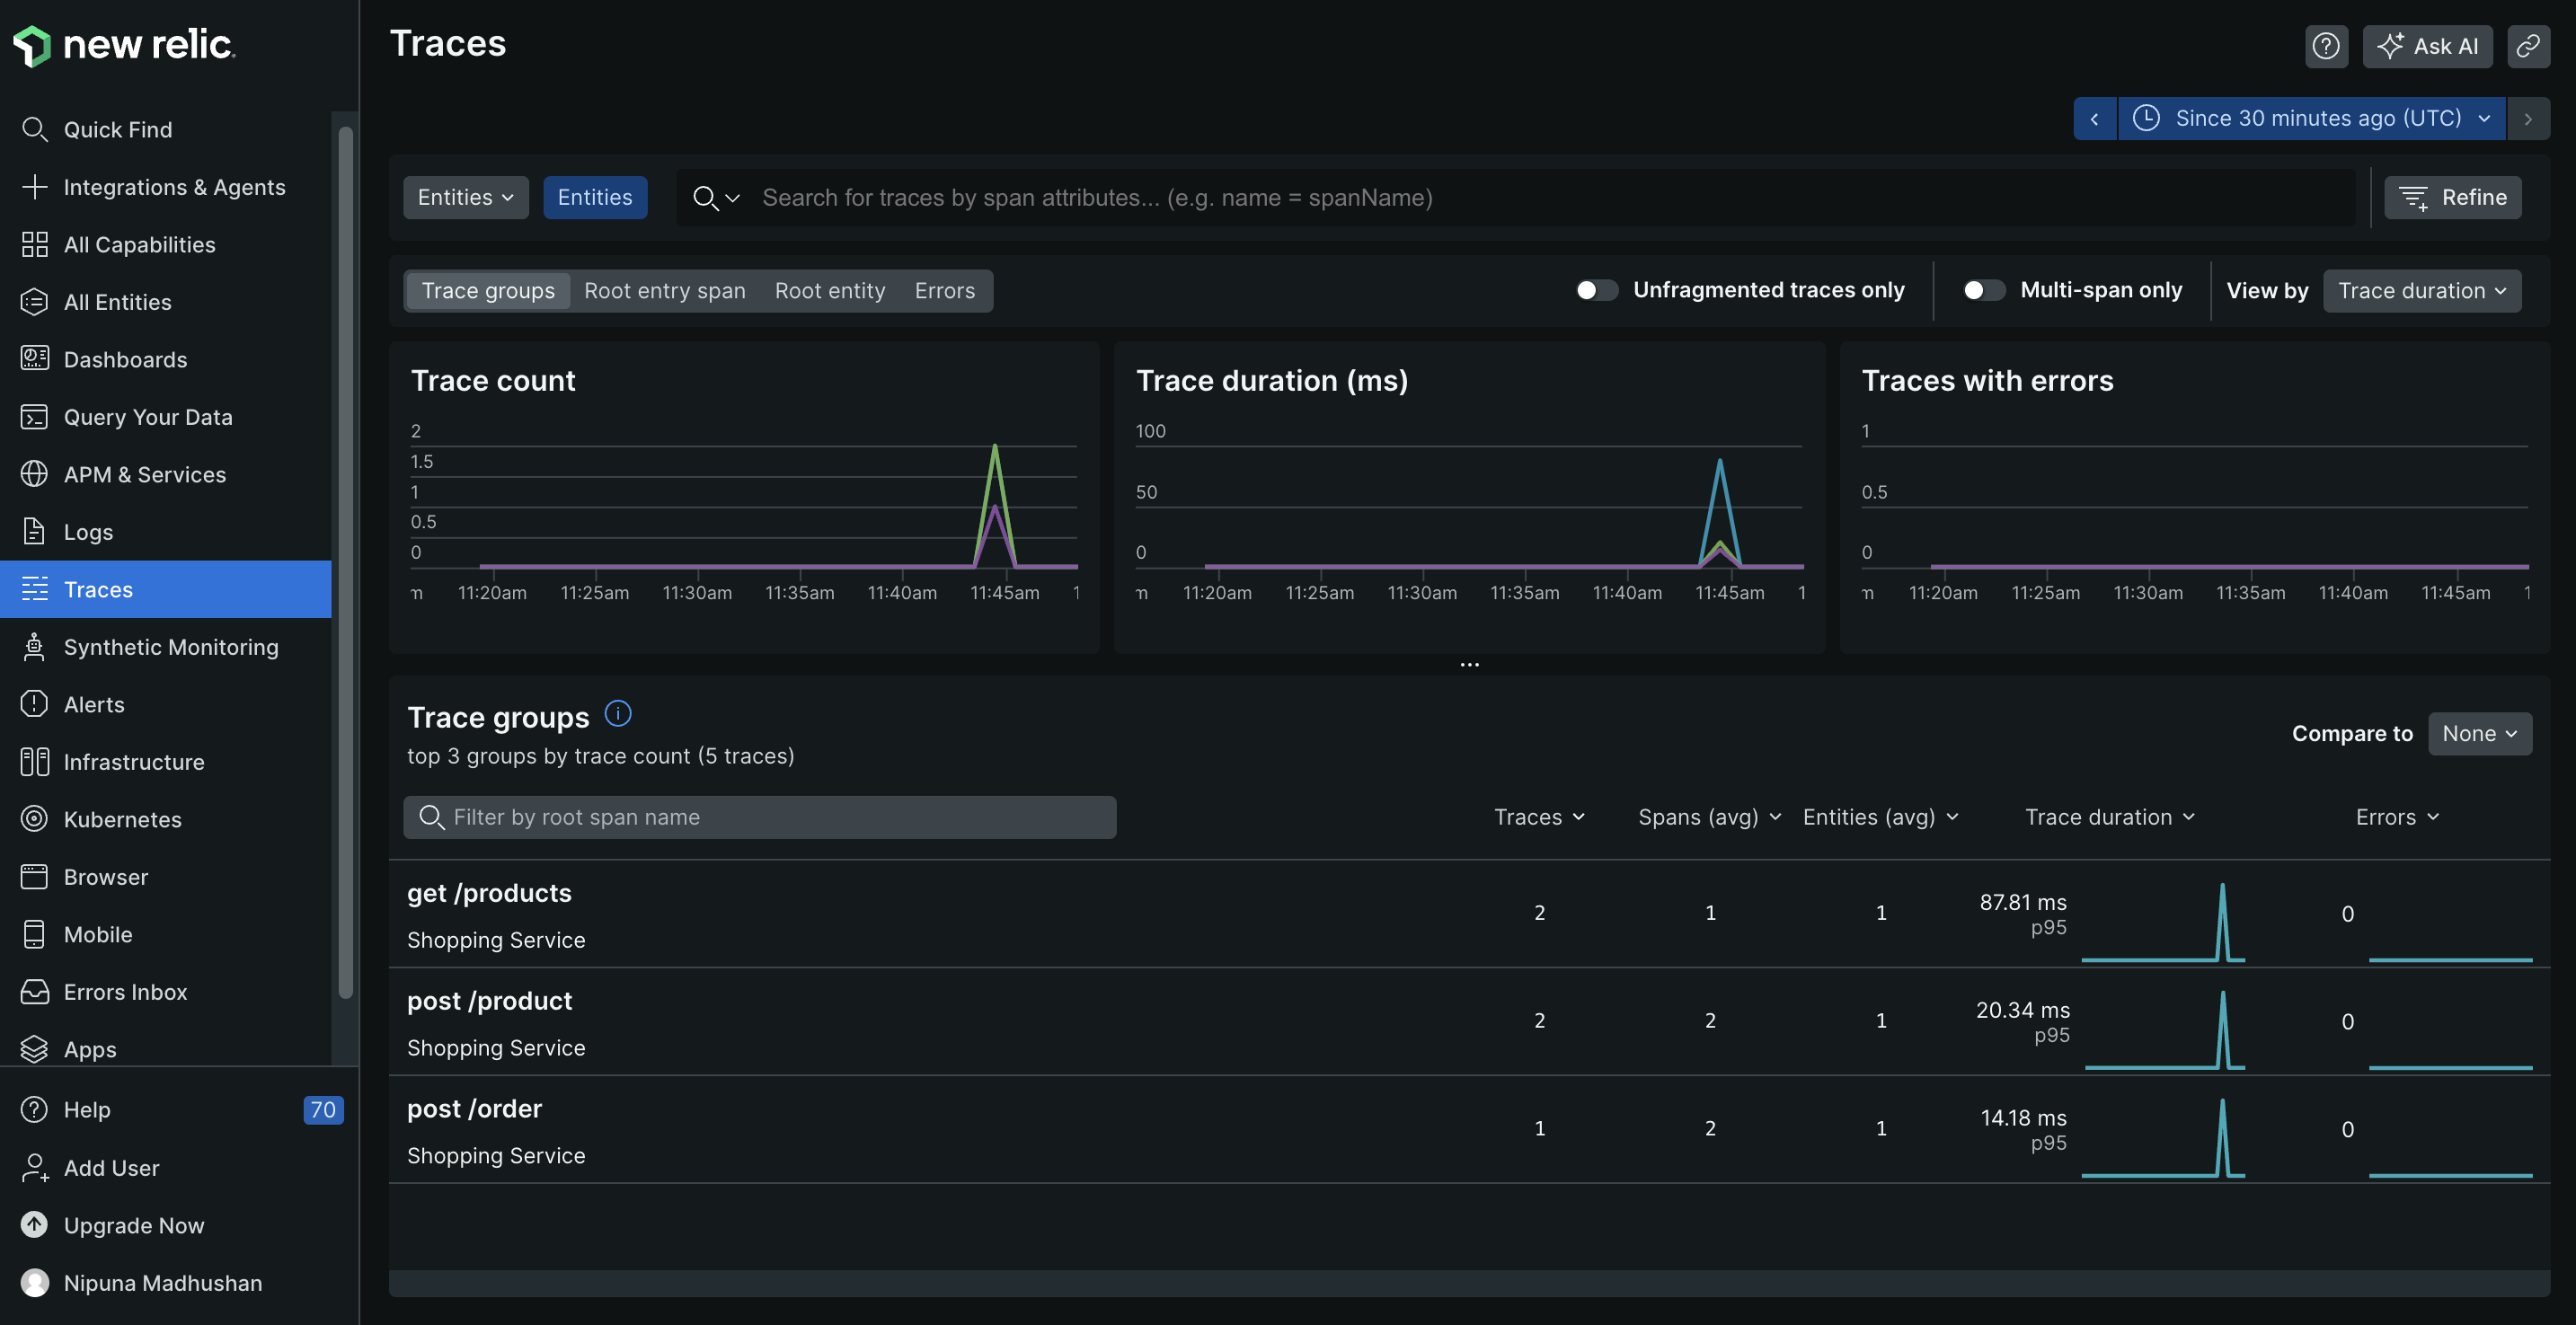
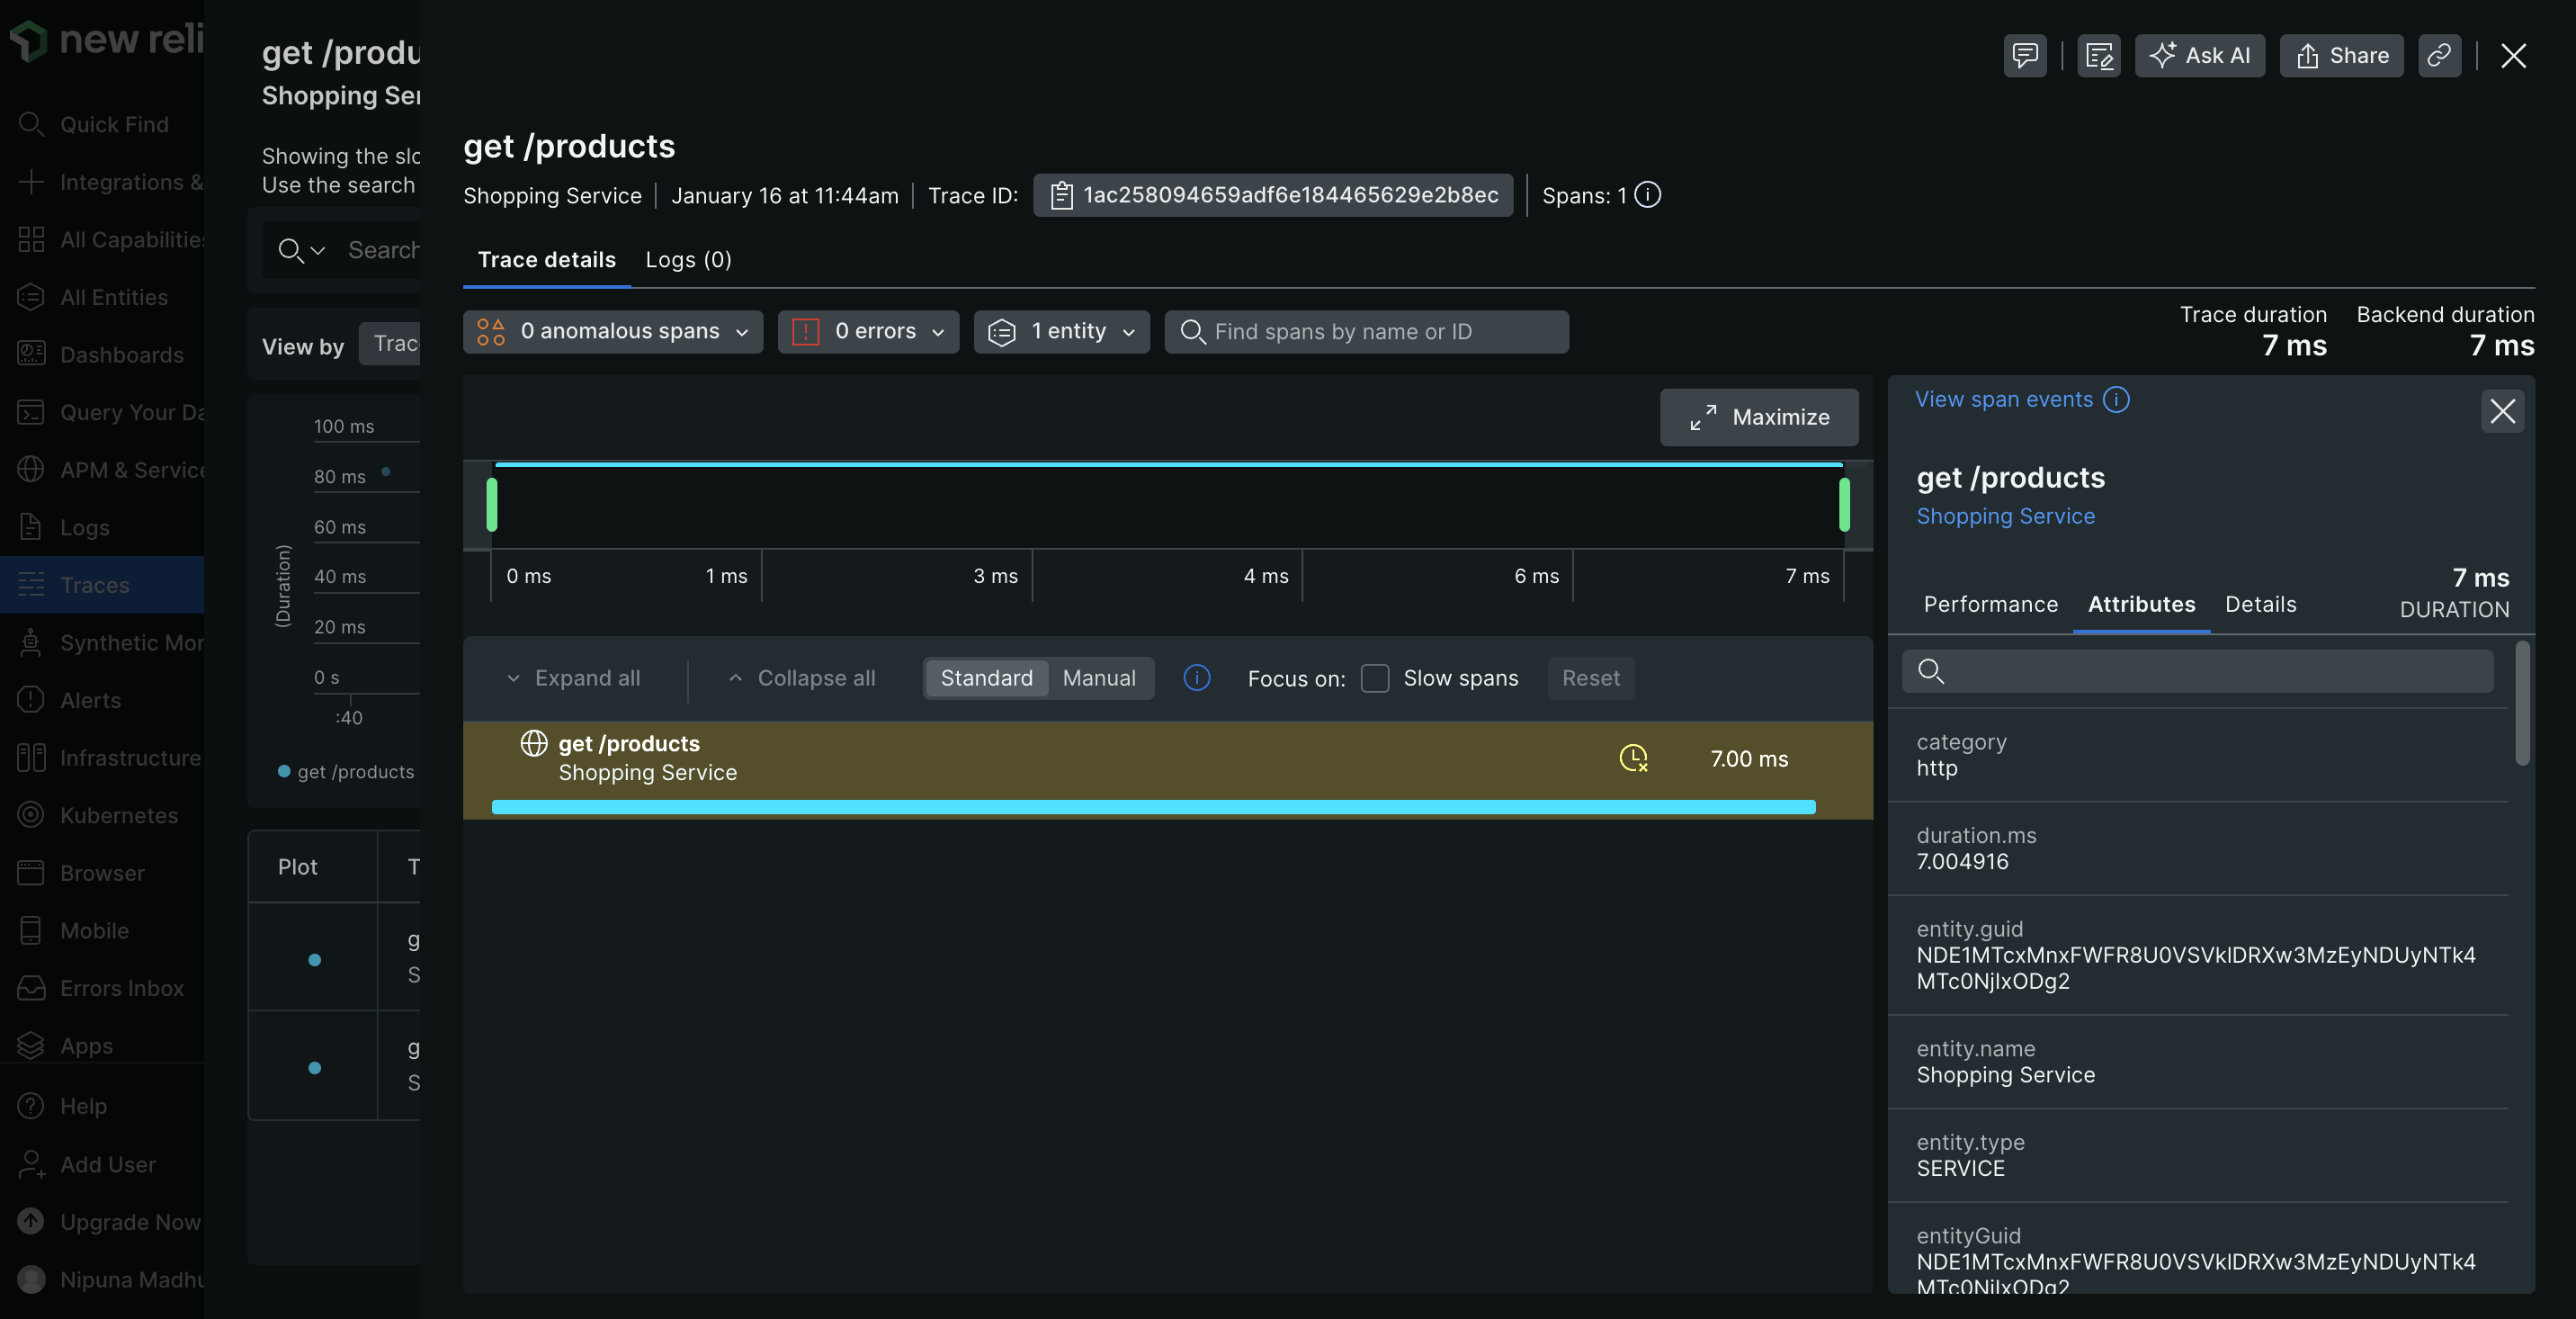
Step 7 - View tracing on the New Relic platform
You can view the traces that were published to the New Relic platform in New Relic traces.

