- Write a RESTful API with Ballerina
- Write a gRPC service with Ballerina
- Write a GraphQL API with Ballerina
- Work with data using queries in Ballerina
- Build a data service in Ballerina
- Build a Change Data Capture (CDC) service in Ballerina
- Work with Large Language Models (LLMs) using natural expressions
- Deploy Ballerina on Kubernetes
- Manage data persistence with bal persist
- Create your first connector with Ballerina
Users can observe Ballerina programs with Moesif, which is a powerful API analytics and monetization platform that helps businesses understand, debug, and monetize their API usage. It provides comprehensive API observability with real-time monitoring, behavioral analytics, and AI-powered insights to track customer API adoption and usage patterns.
The sample shop service will be used in this guide.
Follow the steps given below to view Ballerina metrics, traces and logs in Moesif.
Step 1 - Create a Moesif account and get an application ID
After you log into Moesif Portal, get your Moesif Application ID during the onboarding steps.
Application ID can be accessed by following the below steps from Moesif Portal after logging in.
Go to Account -> Settings -> API keys -> Collector Application ID.
Step 2 - Set up Ballerina application for publishing traces and metrics to Moesif
-
Create the sample shop service.
-
Open the
main.balfile in the Ballerina package and add the following imports.import ballerinax/moesif as _; -
Create the
Config.tomlfile in the package directory to set the runtime configurations. -
To enable the extension and publish traces to Moesif, add the following to the
Config.toml.[ballerina.observe] tracingEnabled=true tracingProvider="moesif" [ballerinax.moesif] applicationId = "<MOESIF_APPLICATION_ID>" # Mandatory Configuration. reporterBaseUrl = "https://api.moesif.net" # Optional Configuration. Default value is 'https://api.moesif.net' tracingReporterFlushInterval = 1000 # Optional Configuration. Default value is 1000 tracingReporterBufferSize = 10000 # Optional Configuration. Default value is 10000 isTraceLoggingEnabled = false # Optional Configuration. Default value is false isPayloadLoggingEnabled = false # Optional Configuration. Default value is false -
To enable metrics publishing, add the following to the
Config.toml.[ballerina.observe] metricsEnabled=true metricsReporter="moesif" [ballerinax.moesif] applicationId = "<MOESIF_APPLICATION_ID>" # Mandatory Configuration. reporterBaseUrl = "https://api.moesif.net" # Optional Configuration. Default value is 'https://api.moesif.net' metricsReporterFlushInterval = 15000 # Optional Configuration. Default value is 15000 metricsReporterClientTimeout = 10000 # Optional Configuration. Default value is 10000 isTraceLoggingEnabled = false # Optional Configuration. Default value is false isPayloadLoggingEnabled = false # Optional Configuration. Default value is false idleTimePublishingEnabled = false # Optional Configuration. Default value is false # Additional attributes for metrics [ballerinax.moesif.additionalAttributes] key1 = "value1" key2 = "value2" -
Replace
<MOESIF_APPLICATION_ID>with the application ID obtained in Step 1.
The table below provides the descriptions of each configuration option and possible values that can be assigned.
| Configuration key | Description | Default value | Possible values |
|---|---|---|---|
| ballerina.observe.tracingEnabled | Enables or disables the collection of trace data. | false | true or false |
| ballerina.observe.tracingProvider | Specifies Moesif as the tracing provider. | none | "moesif" |
| ballerina.observe.metricsEnabled | Enables or disables the collection of metrics data. | false | true or false |
| ballerina.observe.metricsReporter | Specifies Moesif as the metrics reporter. | none | "moesif" |
| ballerinax.moesif.applicationId | Moesif application ID used for authentication. Mandatory configuration. | none | A valid Moesif application ID string |
| ballerinax.moesif.reporterBaseUrl | The base URL of the Moesif API. | https://api.moesif.net | Any valid Moesif API endpoint URL |
| ballerinax.moesif.tracingReporterFlushInterval | Interval (in milliseconds) for flushing trace data to Moesif. | 1000 | Any positive integer value |
| ballerinax.moesif.tracingReporterBufferSize | Maximum buffer size for trace data before sending to Moesif. | 10000 | Any positive integer value |
| ballerinax.moesif.metricsReporterFlushInterval | Interval (in milliseconds) for flushing metrics data to Moesif. | 15000 | Any positive integer value |
| ballerinax.moesif.metricsReporterClientTimeout | Timeout (in milliseconds) for the metrics reporter client requests. | 10000 | Any positive integer value |
| ballerinax.moesif.isTraceLoggingEnabled | Enables or disables trace logging for debugging purposes. | false | true or false |
| ballerinax.moesif.isPayloadLoggingEnabled | Enables or disables payload logging for debugging purposes. | false | true or false |
| ballerinax.moesif.idleTimePublishingEnabled | Enables or disables publishing metrics in idle time. | false | true or false |
| ballerinax.moesif.additionalAttributes | Additional key-value attributes to include with metrics reporting. | none | Any valid set of key-value pairs. e.g., key1="value1", key2="value2" |
These configurations enable traces and metrics publishing for the Ballerina application and configure the Moesif exporter.
Step 3 - Publish Ballerina application logs to Moesif
This setup leverages Fluent Bit to forward logs to an OTEL Collector, which then sends the logs to Moesif’s log endpoint.
Ballerina → Fluent Bit → OTEL Collector → Moesif
-
Copy the following configs into a local directory to set up containerized log publishing.
. ├── docker-compose.yaml ├── fluent-bit.conf └── otelcol.yaml- docker-compose.yaml – Container setup for Fluent Bit and OTEL Collector.
- fluent-bit.conf – Reads Ballerina logs and forwards them.
- otelcol.yaml – Processes logs and sends to Moesif.
docker-compose.yaml
Update the
<ballerina-log-path>with the log storage location, and<MOESIF_APPLICATION_ID>with the application ID obtained in Step 1.services: otelcol: image: otel/opentelemetry-collector-contrib:0.132.0 container_name: otelcol command: ["--config", "/etc/otelcol.yaml"] environment: MOESIF_APP_ID: "<MOESIF_APPLICATION_ID>" ports: - "4317:4317" - "4318:4318" volumes: - ./otelcol.yaml:/etc/otelcol.yaml:ro networks: - otelnet fluent-bit: image: fluent/fluent-bit:3.0 container_name: fluent-bit depends_on: - otelcol ports: - "2020:2020" volumes: - ./fluent-bit.conf:/fluent-bit/etc/fluent-bit.conf:ro # Mount the local log directory into the container - <ballerina-log-path>:/app/logs:ro networks: - otelnet networks: otelnet: driver: bridgefluent-bit.conf
[SERVICE] Flush 1 Log_Level debug Daemon off HTTP_Server On HTTP_Listen 0.0.0.0 HTTP_Port 2020 # Read logs from local Ballerina app [INPUT] Name tail Path /app/logs/app.log Tag ballerina.* Read_from_Head true Skip_Long_Lines On Skip_Empty_Lines On Refresh_Interval 1 # Add metadata [FILTER] Name modify Match ballerina.* Add service.name ballerina-service Add deployment.environment prod # Convert to OTEL format and send to collector [OUTPUT] Name opentelemetry Match ballerina.* Host otelcol Port 4318 Logs_uri /v1/logs Log_response_payload True Tls Off Tls.verify Off # Debug output to see what's being processed [OUTPUT] Name stdout Match ballerina.* Format json_linesotelcol.yaml
Update the
<MOESIF_APPLICATION_ID>with the application ID obtained in Step 1.receivers: otlp: protocols: grpc: endpoint: "0.0.0.0:4317" http: endpoint: "0.0.0.0:4318" processors: resource: attributes: - key: service.name value: ballerina-service action: upsert - key: deployment.environment value: prod action: upsert transform/severity_from_message: log_statements: - context: log statements: # Set default severity to INFO for all logs first - set(severity_number, 9) where body != nil - set(severity_text, "INFO") where body != nil # Try to parse JSON body, but handle parsing errors gracefully - set(cache["is_json"], false) - set(cache["is_json"], true) where body != nil and IsMatch(body, "^\\s*\\{") # For JSON logs, parse and extract level - set(cache["parsed_body"], ParseJSON(body)) where cache["is_json"] == true # Override with specific levels based on JSON level field - set(severity_number, 1) where cache["is_json"] == true and cache["parsed_body"]["level"] == "TRACE" - set(severity_text, "TRACE") where cache["is_json"] == true and cache["parsed_body"]["level"] == "TRACE" - set(severity_number, 5) where cache["is_json"] == true and cache["parsed_body"]["level"] == "DEBUG" - set(severity_text, "DEBUG") where cache["is_json"] == true and cache["parsed_body"]["level"] == "DEBUG" - set(severity_number, 9) where cache["is_json"] == true and cache["parsed_body"]["level"] == "INFO" - set(severity_text, "INFO") where cache["is_json"] == true and cache["parsed_body"]["level"] == "INFO" - set(severity_number, 13) where cache["is_json"] == true and cache["parsed_body"]["level"] == "WARN" - set(severity_text, "WARN") where cache["is_json"] == true and cache["parsed_body"]["level"] == "WARN" - set(severity_number, 17) where cache["is_json"] == true and cache["parsed_body"]["level"] == "ERROR" - set(severity_text, "ERROR") where cache["is_json"] == true and cache["parsed_body"]["level"] == "ERROR" - set(severity_number, 21) where cache["is_json"] == true and cache["parsed_body"]["level"] == "FATAL" - set(severity_text, "FATAL") where cache["is_json"] == true and cache["parsed_body"]["level"] == "FATAL" batch: {} exporters: # OTLP over HTTP to Moesif otlphttp: endpoint: "https://api.moesif.net" logs_endpoint: "https://api.moesif.net/v1/logs" headers: X-Moesif-Application-Id: "<MOESIF_APPLICATION_ID>" compression: none timeout: 10s sending_queue: enabled: true num_consumers: 2 queue_size: 512 retry_on_failure: enabled: true initial_interval: 1s max_interval: 10s max_elapsed_time: 0s service: telemetry: logs: level: debug pipelines: logs: receivers: [otlp] processors: [resource, transform/severity_from_message, batch] exporters: [otlphttp] -
Run the above components stack using the following command.
docker compose up -
Create the
Config.tomlfile in the package directory with the following content to log to a file injsonformat.[ballerina.log] format = "json" [[ballerina.log.destinations]] # Replace /path/to/your/ballerina/logs with the absolute path to the Ballerina application's log directory path = "/path/to/your/ballerina/logs/app.log"
Step 4 - Run the Ballerina service
When Ballerina observability is enabled, the Ballerina runtime collects metrics, logs, and traces.
Run the following command to start the Ballerina service.
$ bal run Compiling source Running executable ballerina: started publishing traces to Moesif HTTP endpoint at https://api.moesif.net/v1/traces ballerina: started publishing metrics to Moesif endpoint: https://api.moesif.net/v1/actions/batch with 2 additional attributes
Step 5 - Send requests
Send requests to http://localhost:8090/shop.
Example cURL commands:
$ curl -X GET http://localhost:8090/shop/products
$ curl -X POST http://localhost:8090/shop/product \ -H "Content-Type: application/json" \ -d '{ "id": 4, "name": "Laptop Charger", "price": 50.00 }'
$ curl -X POST http://localhost:8090/shop/order \ -H "Content-Type: application/json" \ -d '{ "productId": 1, "quantity": 1 }'
$ curl -X GET http://localhost:8090/shop/order/0
Step 6 - Visualize the observability data in Moesif dashboards
Traces, metrics, and logs are published to Moesif as events and can be explored in the Live Event Log for real-time monitoring. Moesif provides a set of pre-built dashboards that help visualize and analyze this data effectively. In addition, custom dashboards can be created to gain deeper, domain-specific insights.
The following sample dashboards illustrate how different types of observability data can be monitored and analyzed.
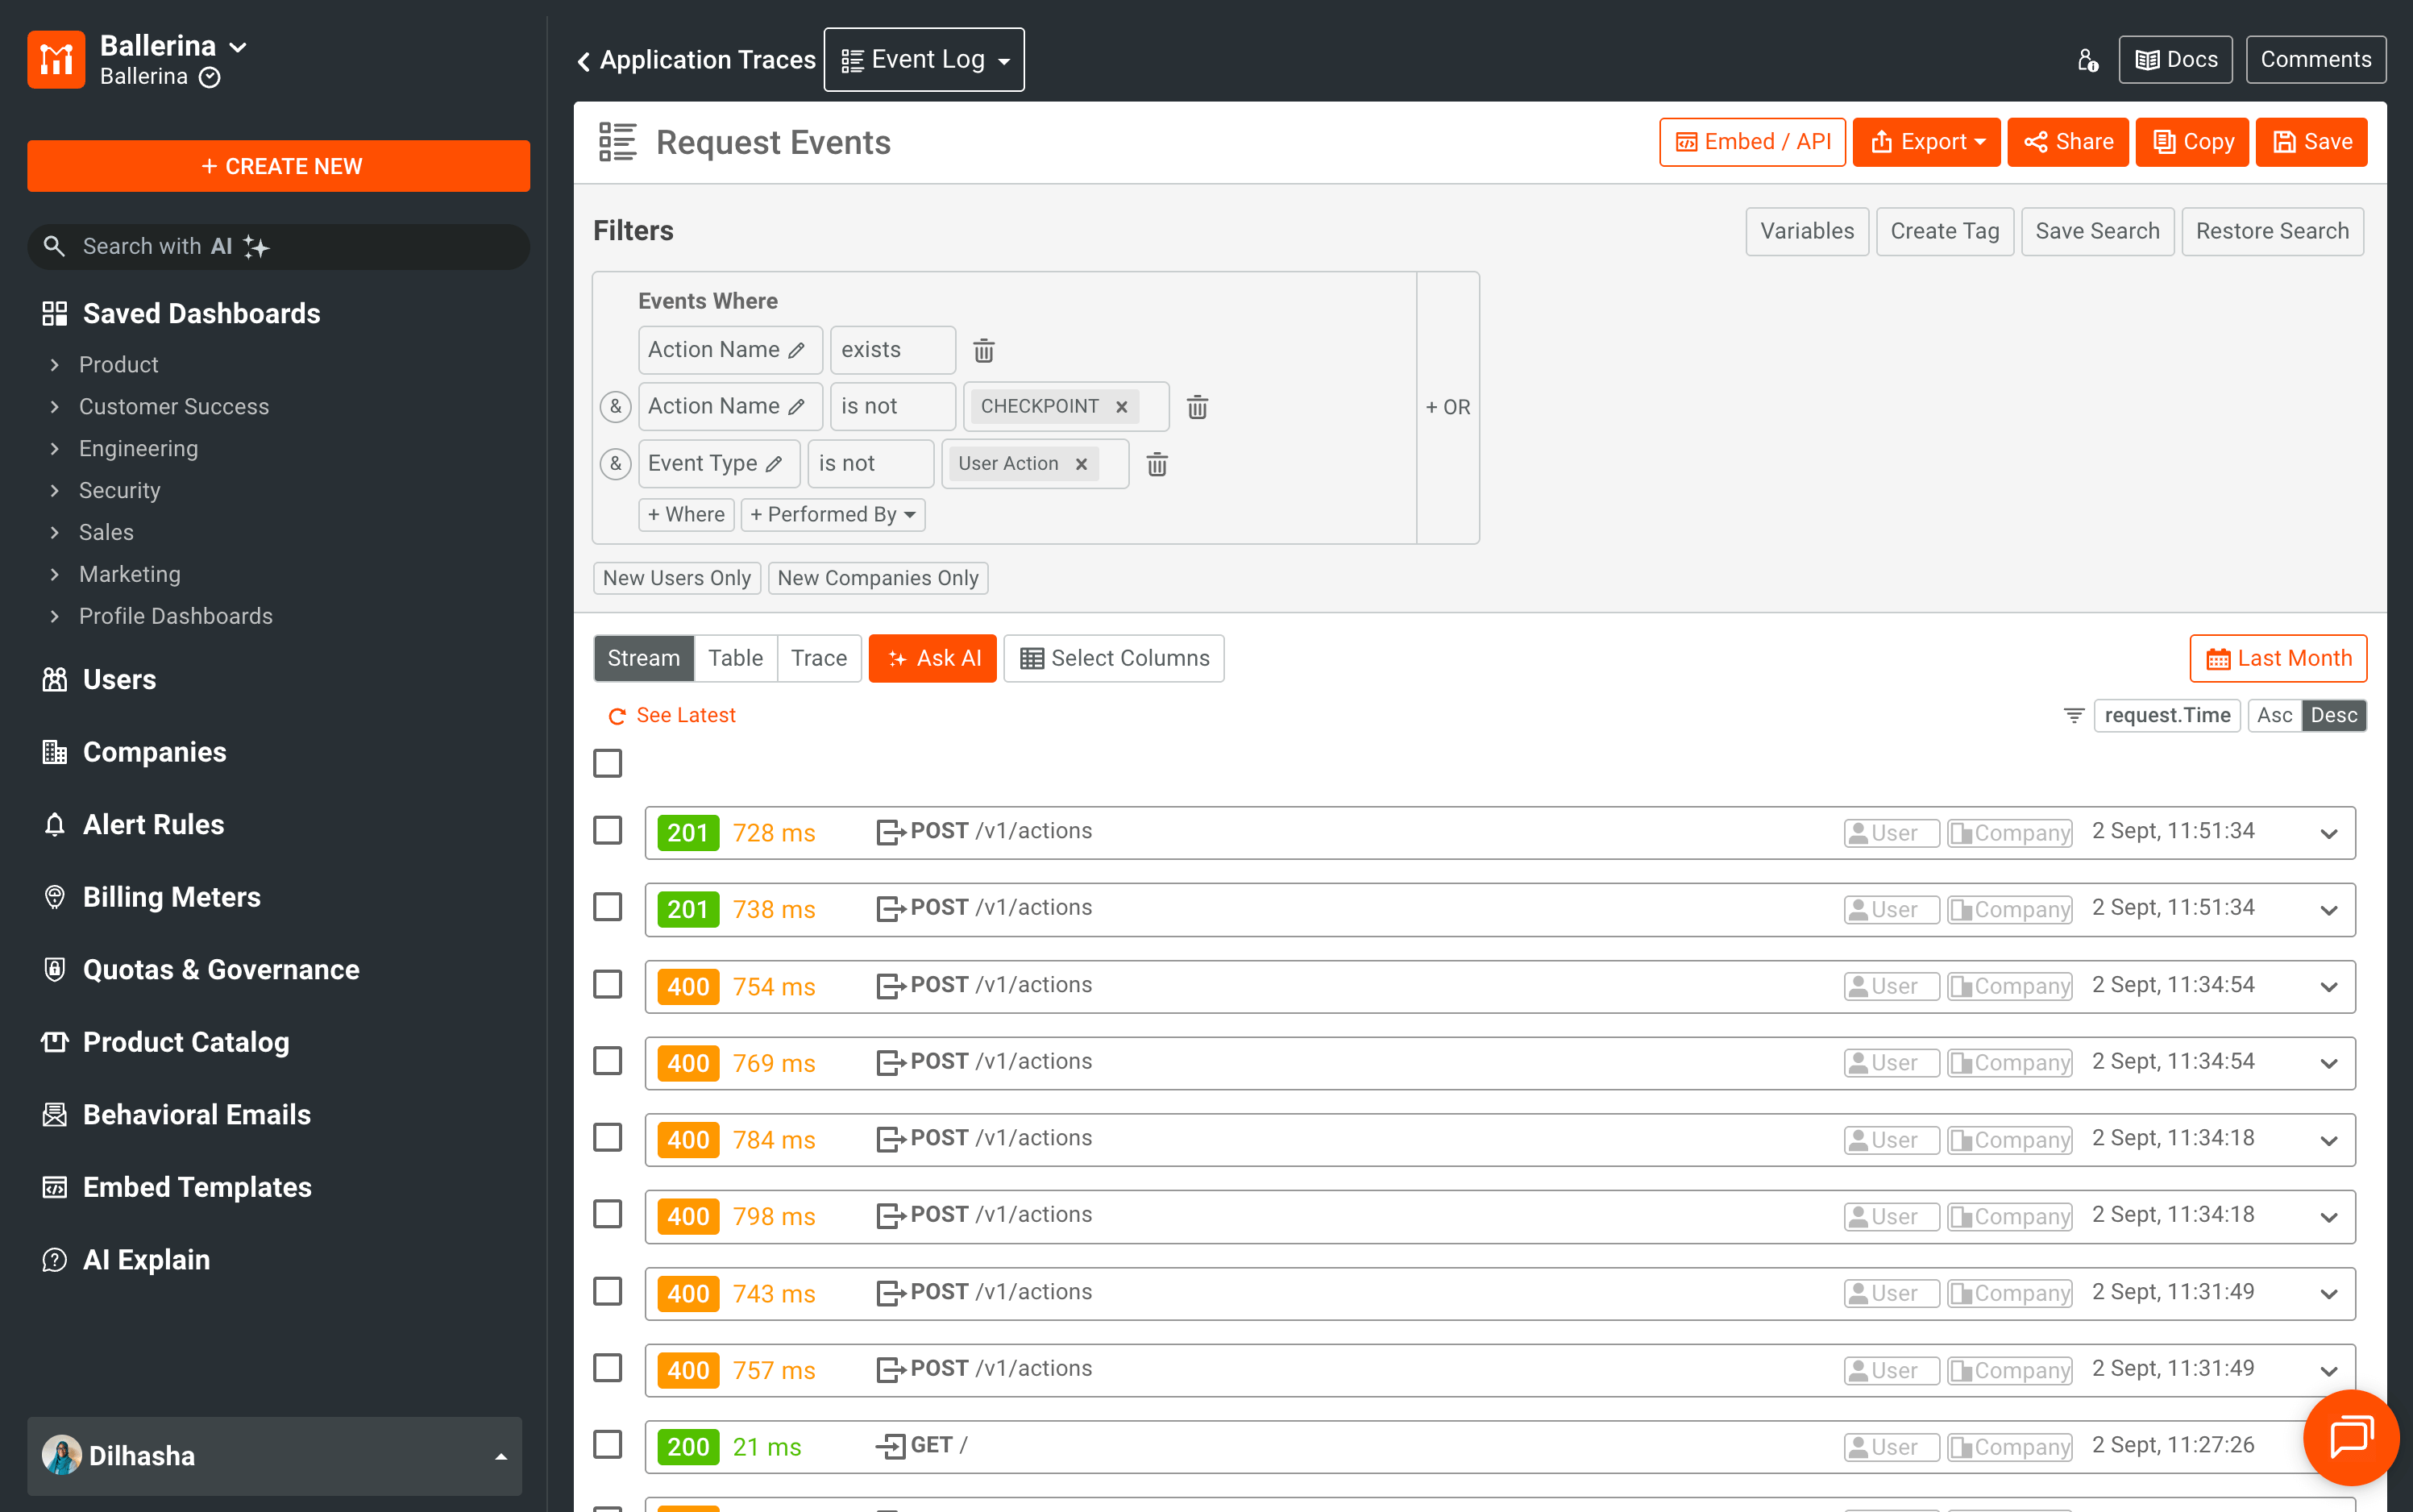
Traces Dashboard
Used to filter and view incoming requests. You can drill down into each request to track its related traces in detail.
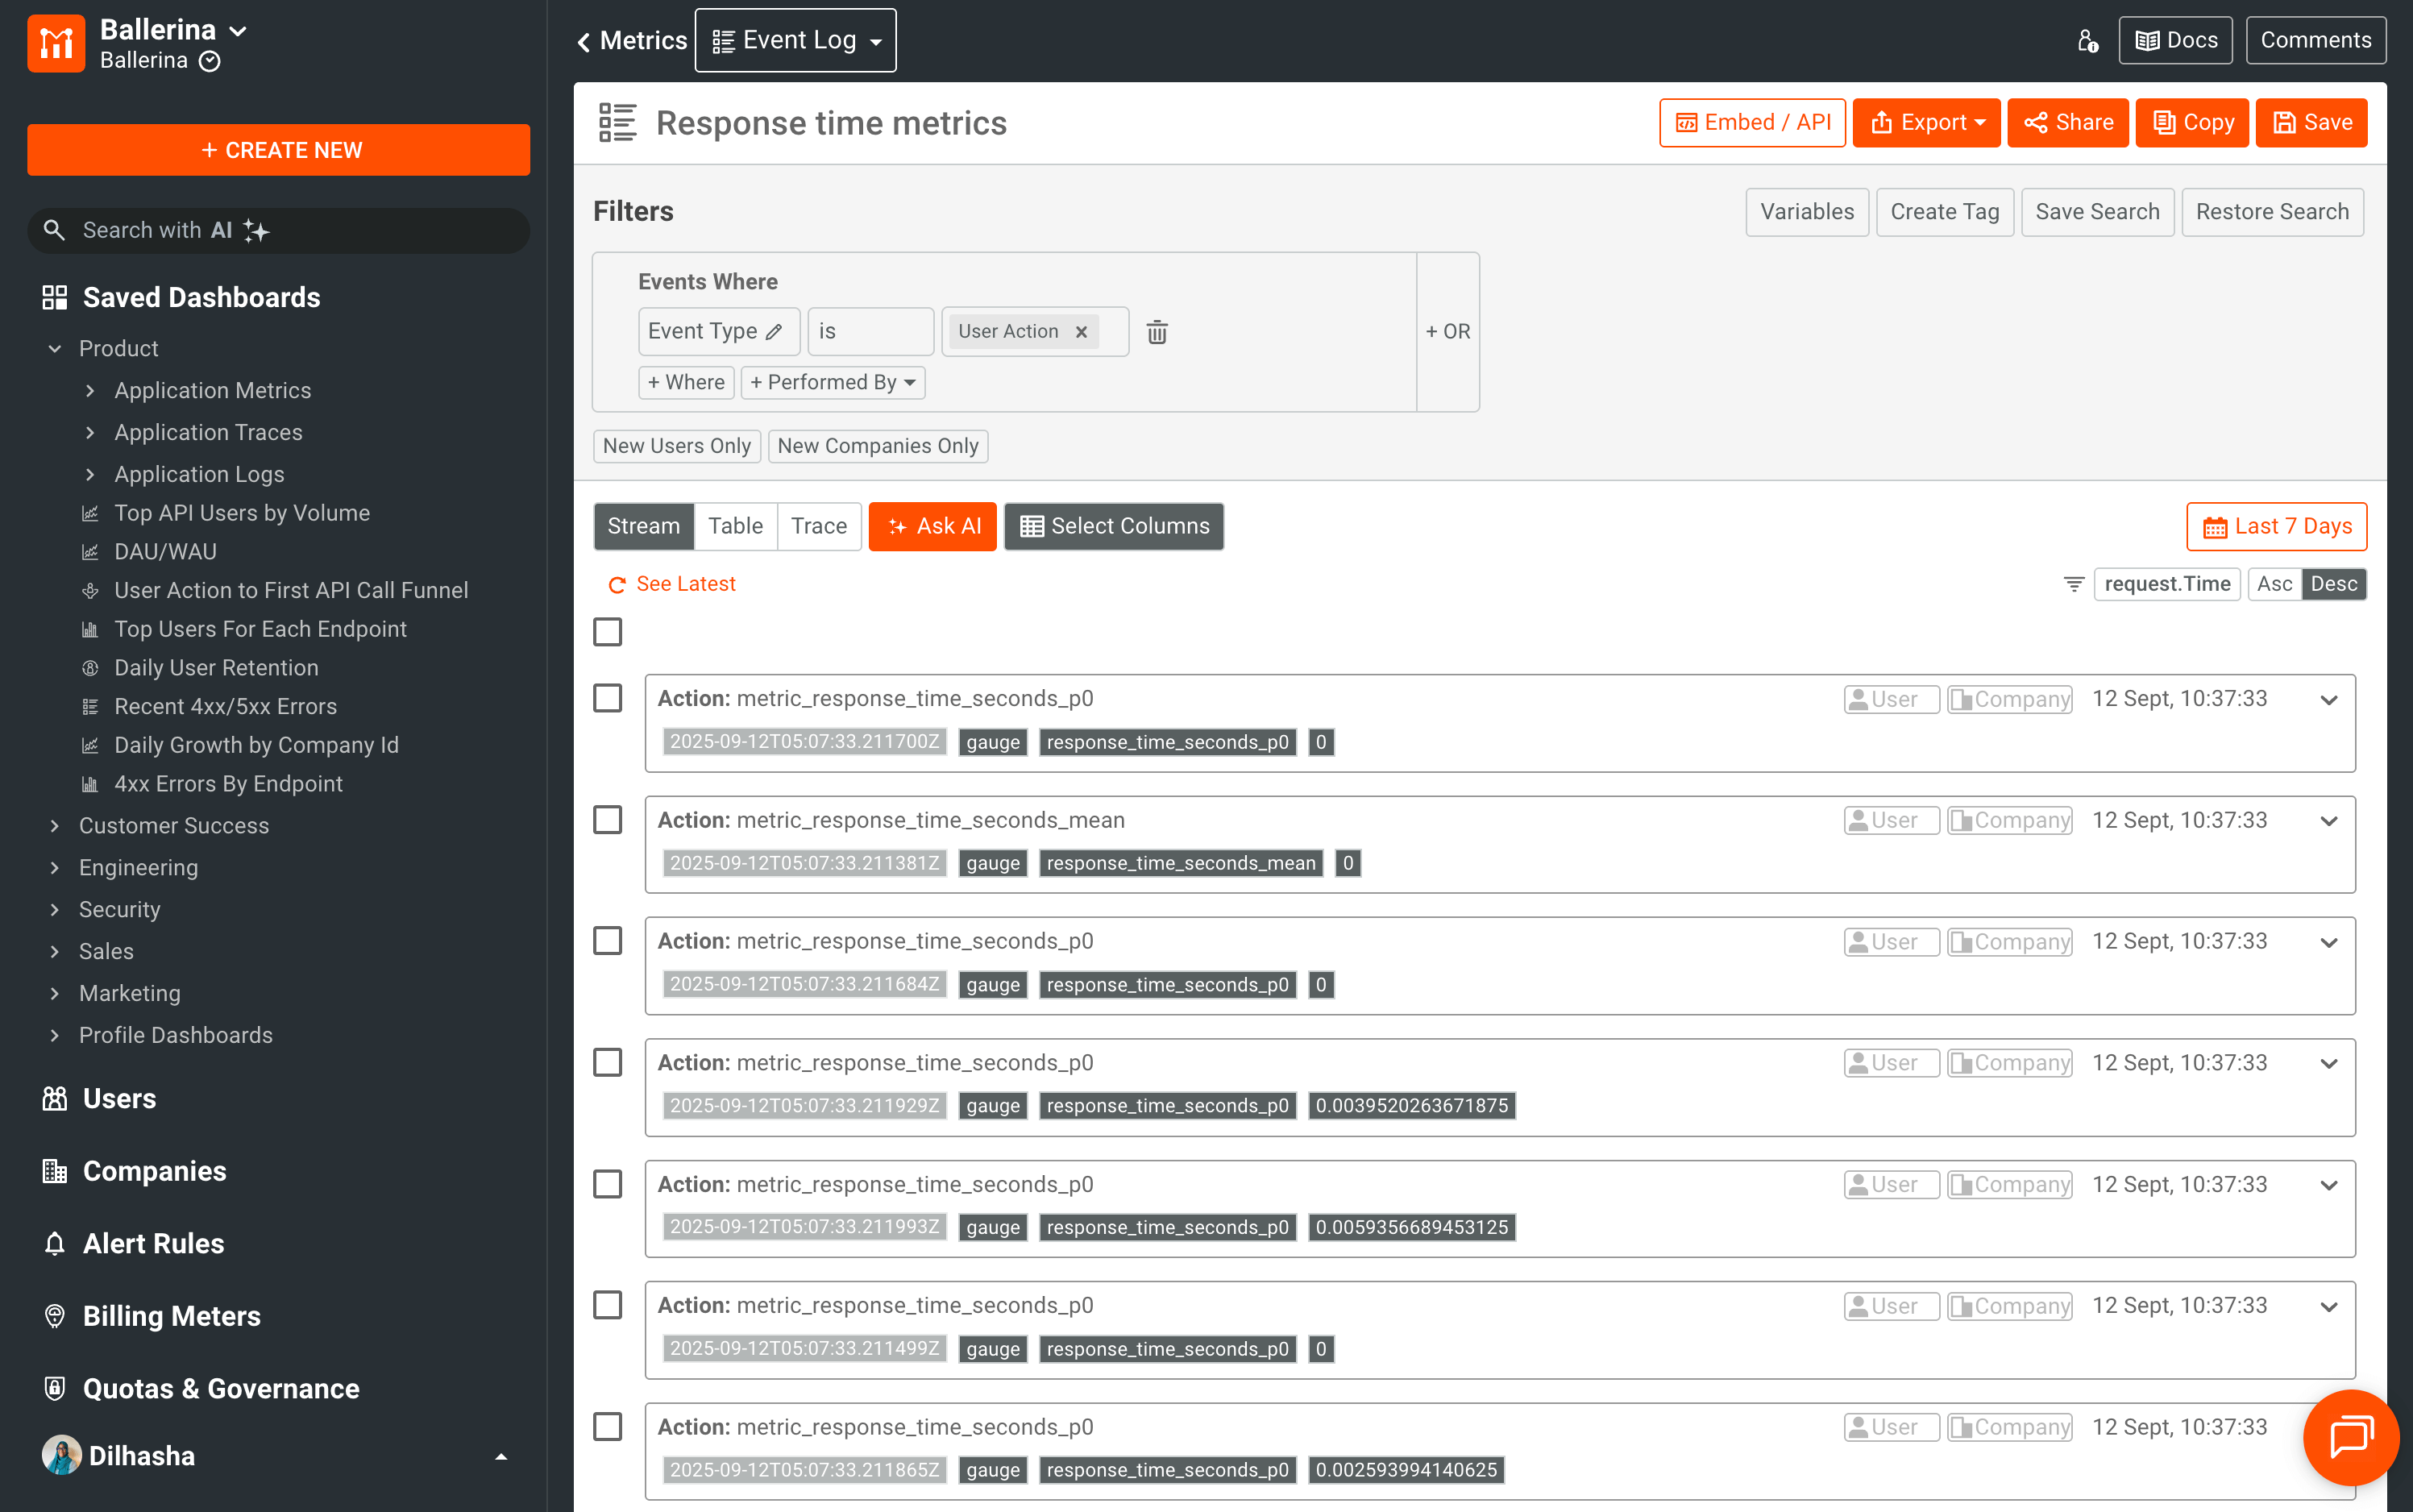
Metrics Dashboard
Provides visibility into key performance indicators such as latency, throughput, and error rates.
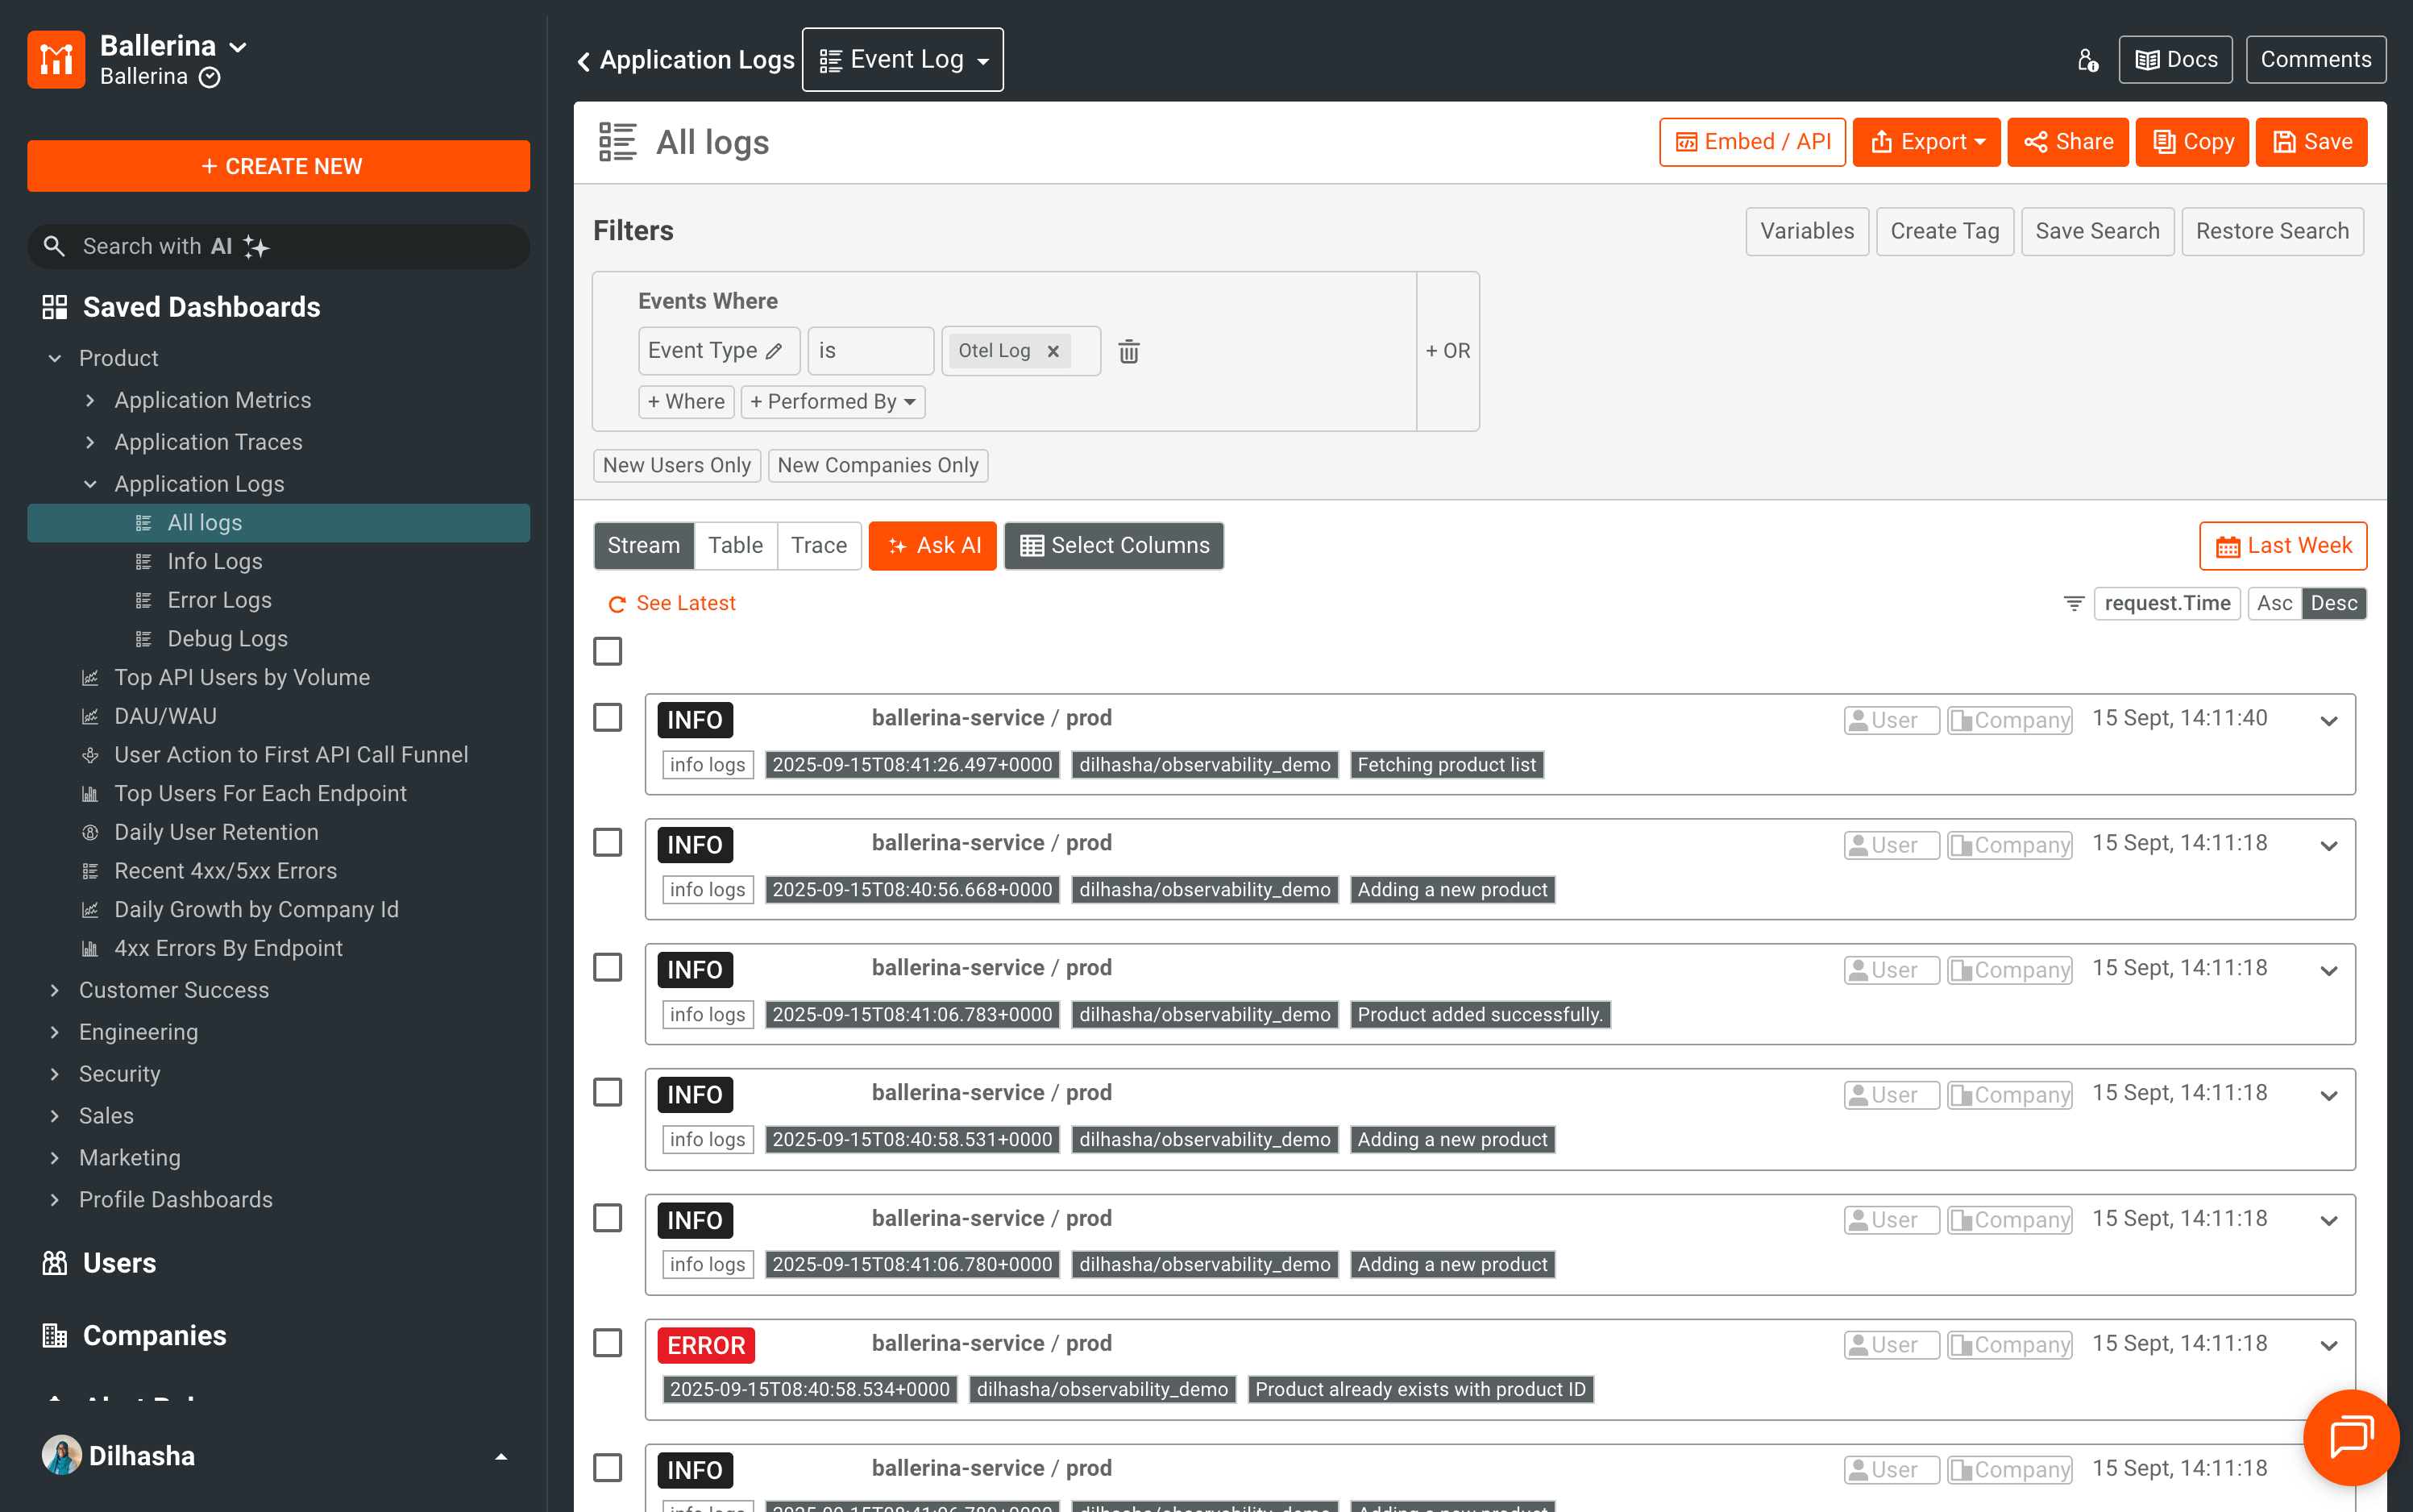
Logs Dashboard
Displays log events captured from the application.