- Write a RESTful API with Ballerina
- Write a gRPC service with Ballerina
- Write a GraphQL API with Ballerina
- Work with data using queries in Ballerina
- Build a data service in Ballerina
- Build a Change Data Capture (CDC) service in Ballerina
- Work with Large Language Models (LLMs) using natural expressions
- Deploy Ballerina on Kubernetes
- Manage data persistence with bal persist
- Create your first connector with Ballerina
The Ballerina scan tool is a static code analysis tool that performs analysis on Ballerina projects and identifies potential code smells, bugs, and vulnerabilities without executing them.
Note: Ballerina scan is an experimental feature that supports only a limited set of rules.
Install the tool
Execute the command below to pull the scan tool from Ballerina Central.
$ bal tool pull scan
To verify the installation and check the version:
$ bal tool list
For more information about managing Ballerina tools, refer to the Ballerina CLI tool command documentation.
Command syntax
The Ballerina scan tool follows this general syntax:
$ bal scan [OPTIONS] [<package>|<source-file>]
Arguments
<package>: Analyzes all Ballerina files in the specified package (optional, defaults to current directory)<source-file>: Analyzes a specific standalone Ballerina file (.balextension required)
Important: Analyzing individual Ballerina files that are part of a package is not allowed. You must analyze the entire package or work with standalone files.
Available options
| Option | Description |
|---|---|
--target-dir=<path> | Specify target directory for analysis reports |
--scan-report | Generate HTML report with detailed analysis results |
--format=<ballerina|sarif> | Specify the format of the report. Default is ballerina |
--list-rules | Display all available analysis rules |
--include-rules=<rule1, ...> | Run analysis for specific rules only |
--exclude-rules=<rule1, ...> | Exclude specific rules from analysis |
--platforms=<platform1, ...> | Define platforms for result reporting |
Running analysis
You can analyze all Ballerina files in the current package by running the following command inside the package directory:
$ bal scan
This command will:
- Compile and analyze all
.balfiles in the current package - Print results to the console
- Save results in JSON format in the
target/scandirectory
If you want to analyze a specific package, you can provide the package name as an argument:
$ bal scan mypackage
If you want to analyze a specific standalone Ballerina file, you can provide the file name as an argument:
$ bal scan myfile.bal
Report generation
To generate a detailed HTML report of the analysis results, use the --scan-report option:
$ bal scan --scan-report
This will produce an HTML report and scan results in JSON format inside the target/report directory.
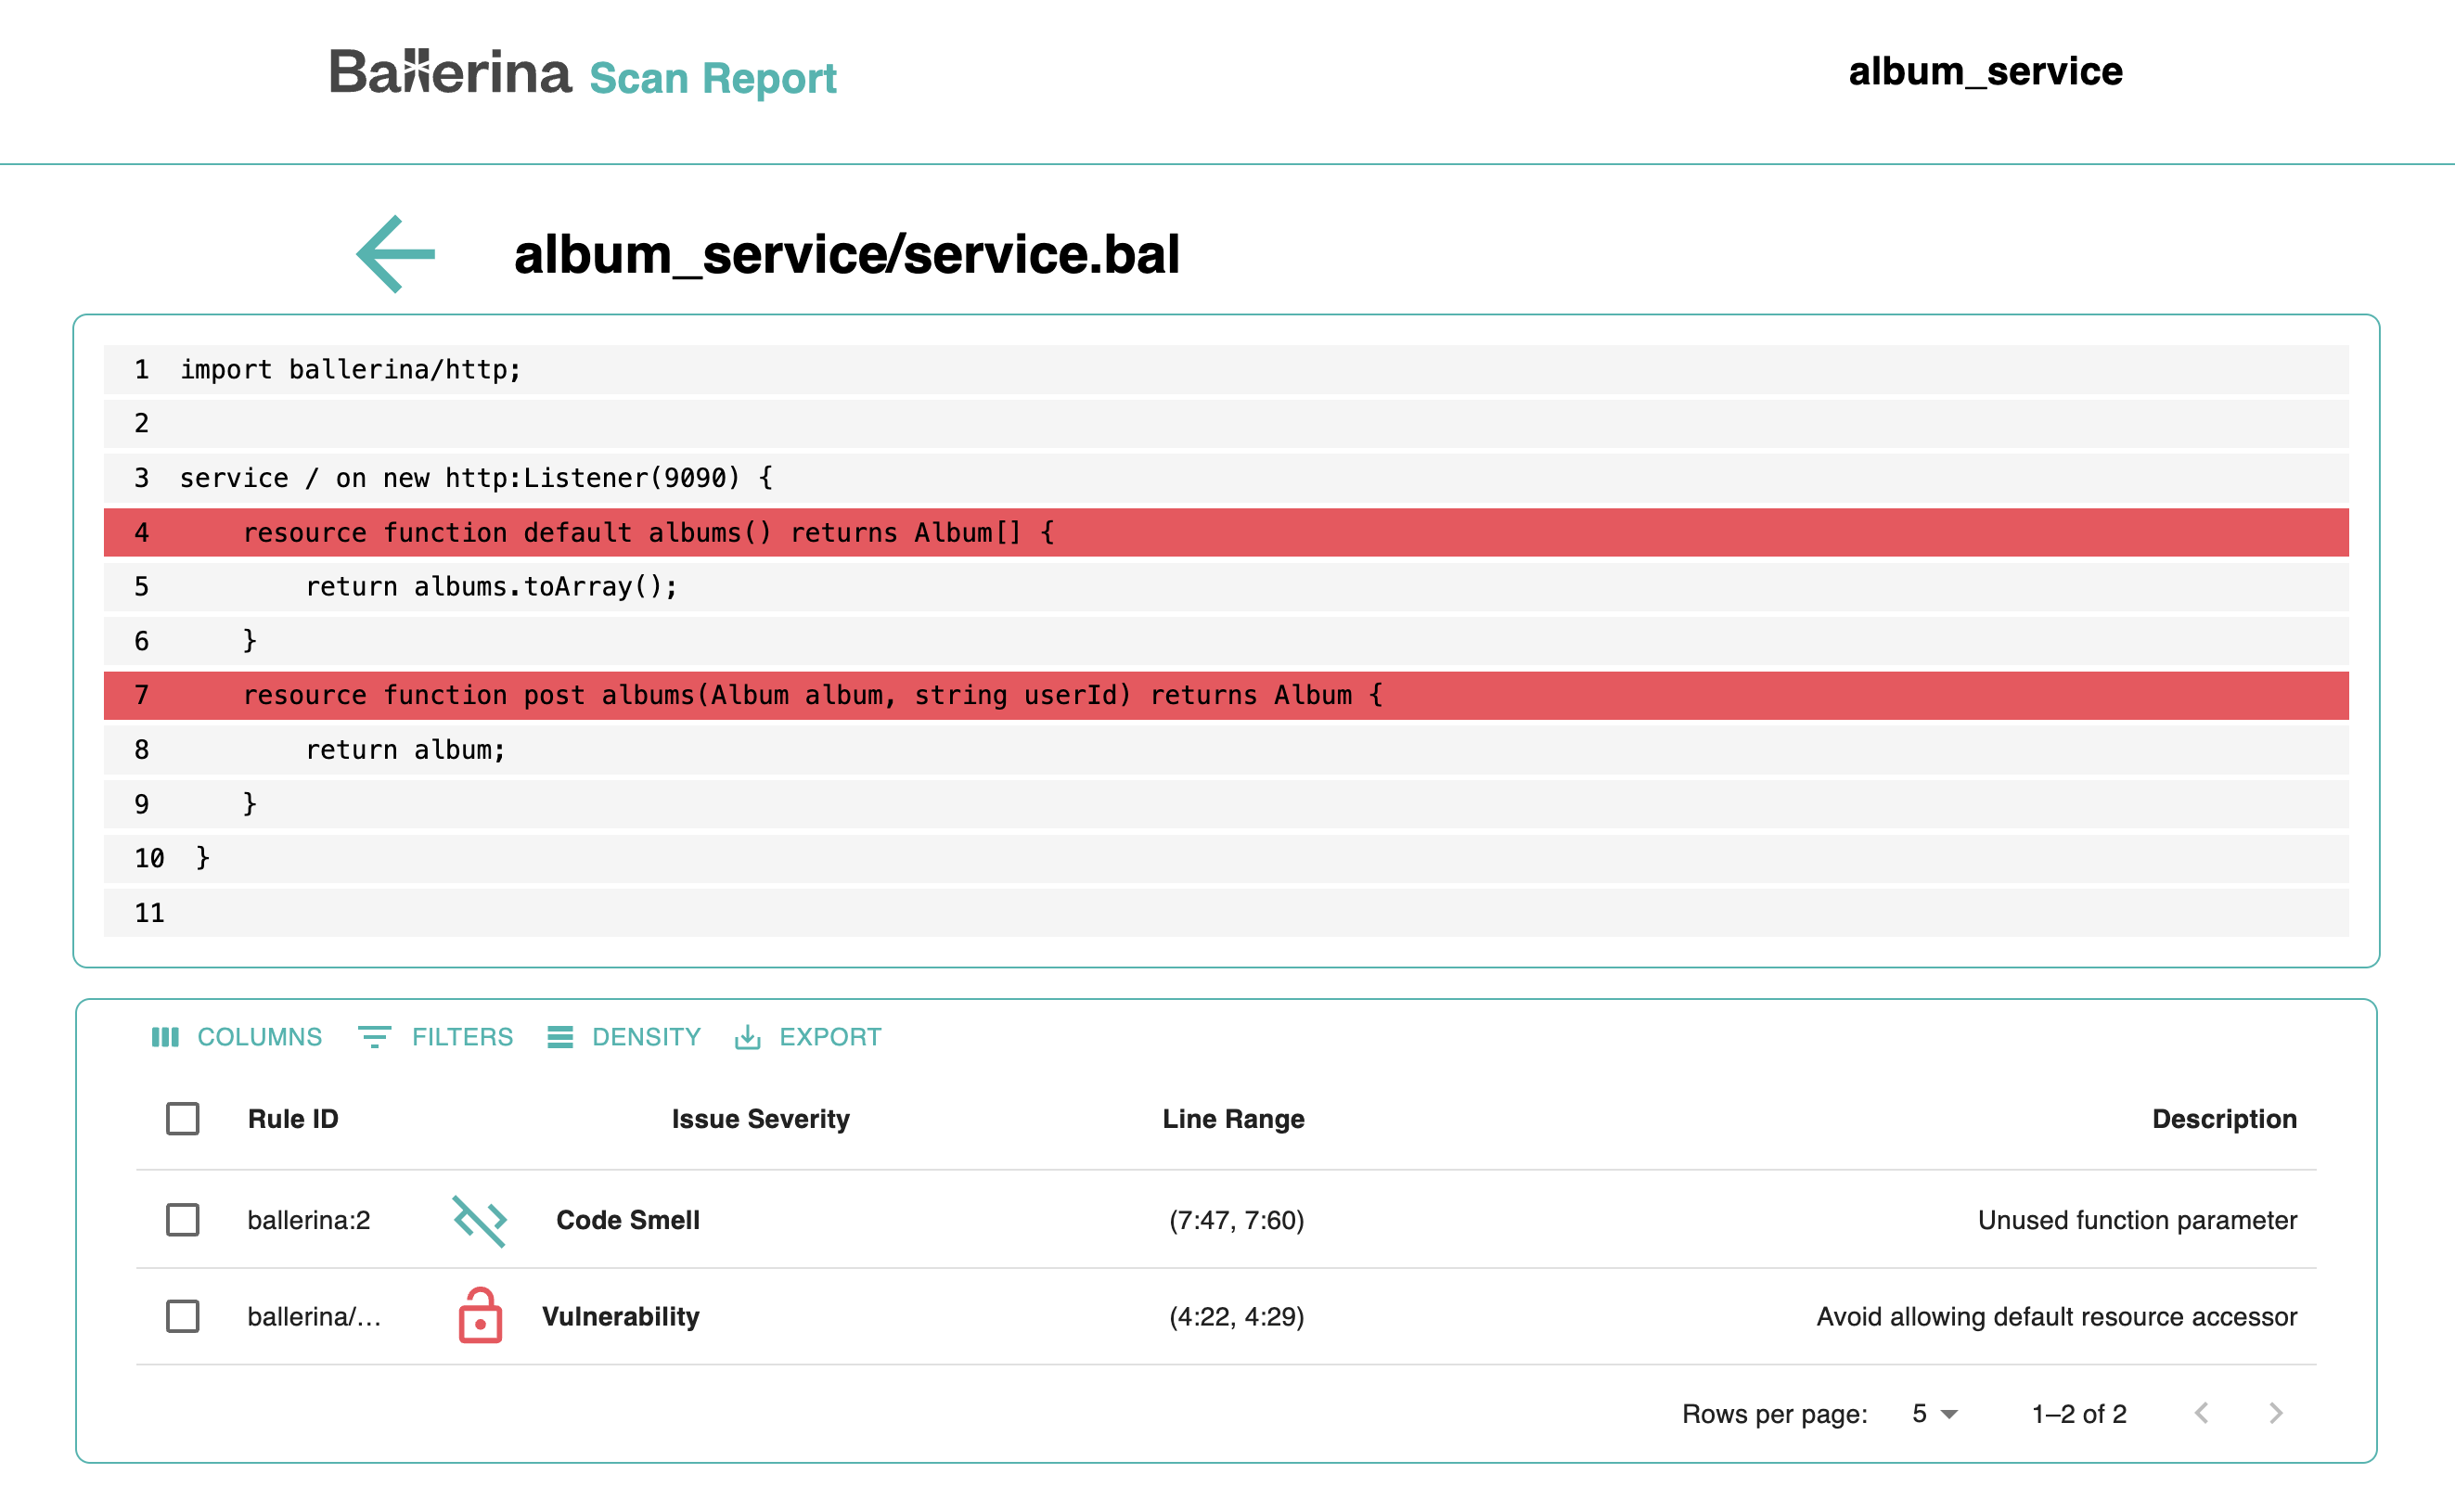
The HTML report includes a summary of the number of code smells, bugs, and vulnerabilities found in each file.
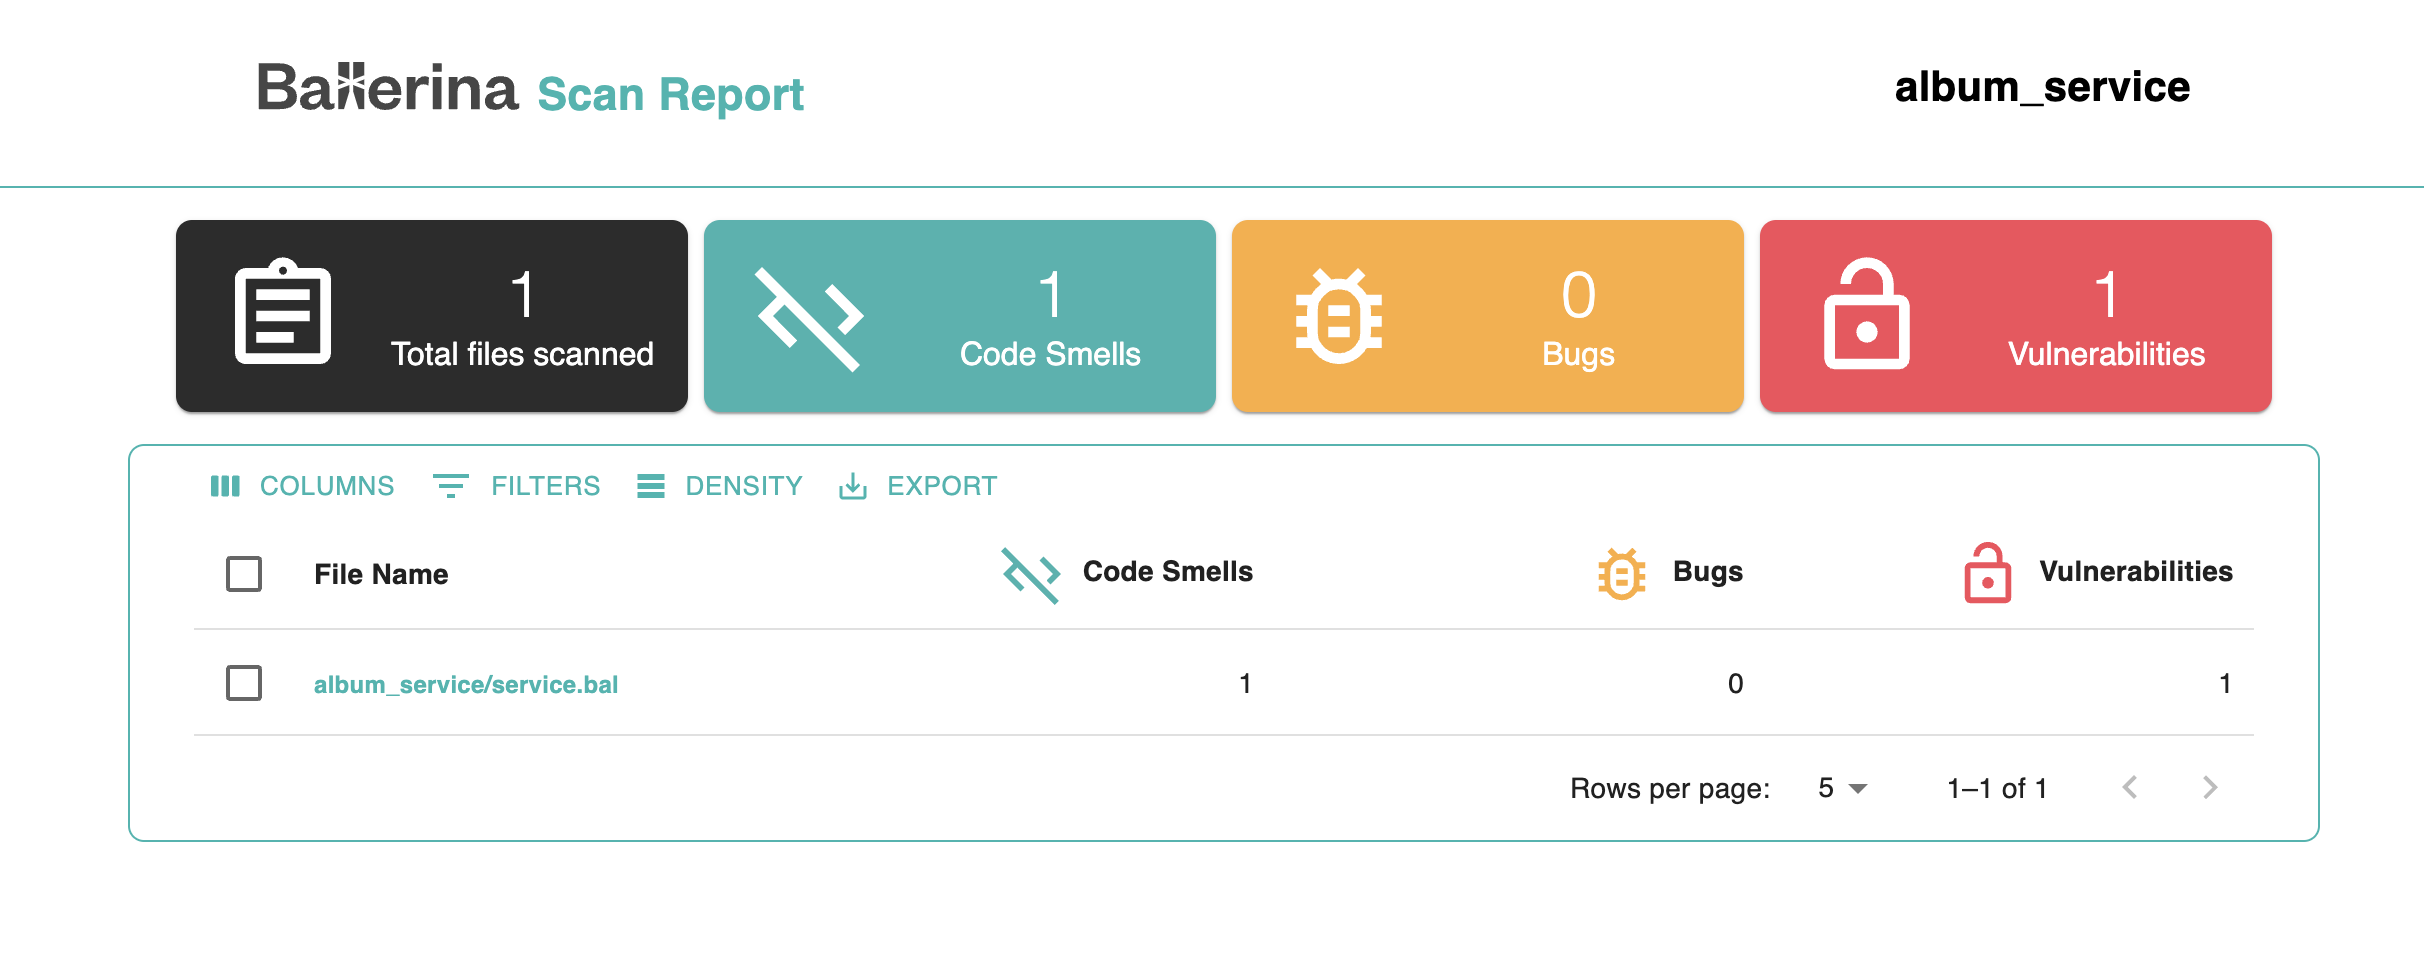
To investigate further, you can click on a file name to view a detailed breakdown of the issues. This view highlights the exact lines where problems were detected, along with a description, and the severity level.
Custom target directory
You can specify a custom target directory for the analysis results using the --target-dir option.
This is useful if you want to store the results in a specific location or if you are working with multiple projects.
$ bal scan --target-dir="path/to/your/target/directory"
Report formats
By default, the scan tool generates reports in JSON format.
However, you can specify the report format using the --format option.
The available formats are ballerina and sarif. The ballerina format is the default, while sarif is a
standardized format for static analysis results.
To generate a report in the sarif format, use the following command:
$ bal scan --format=sarif
List available rules
To view all available rules for your project, you can use the --list-rules option:
$ bal scan --list-rules
This will display a comprehensive list of available rules for your project, which you can include or exclude in future scans.
The output will look something like this:
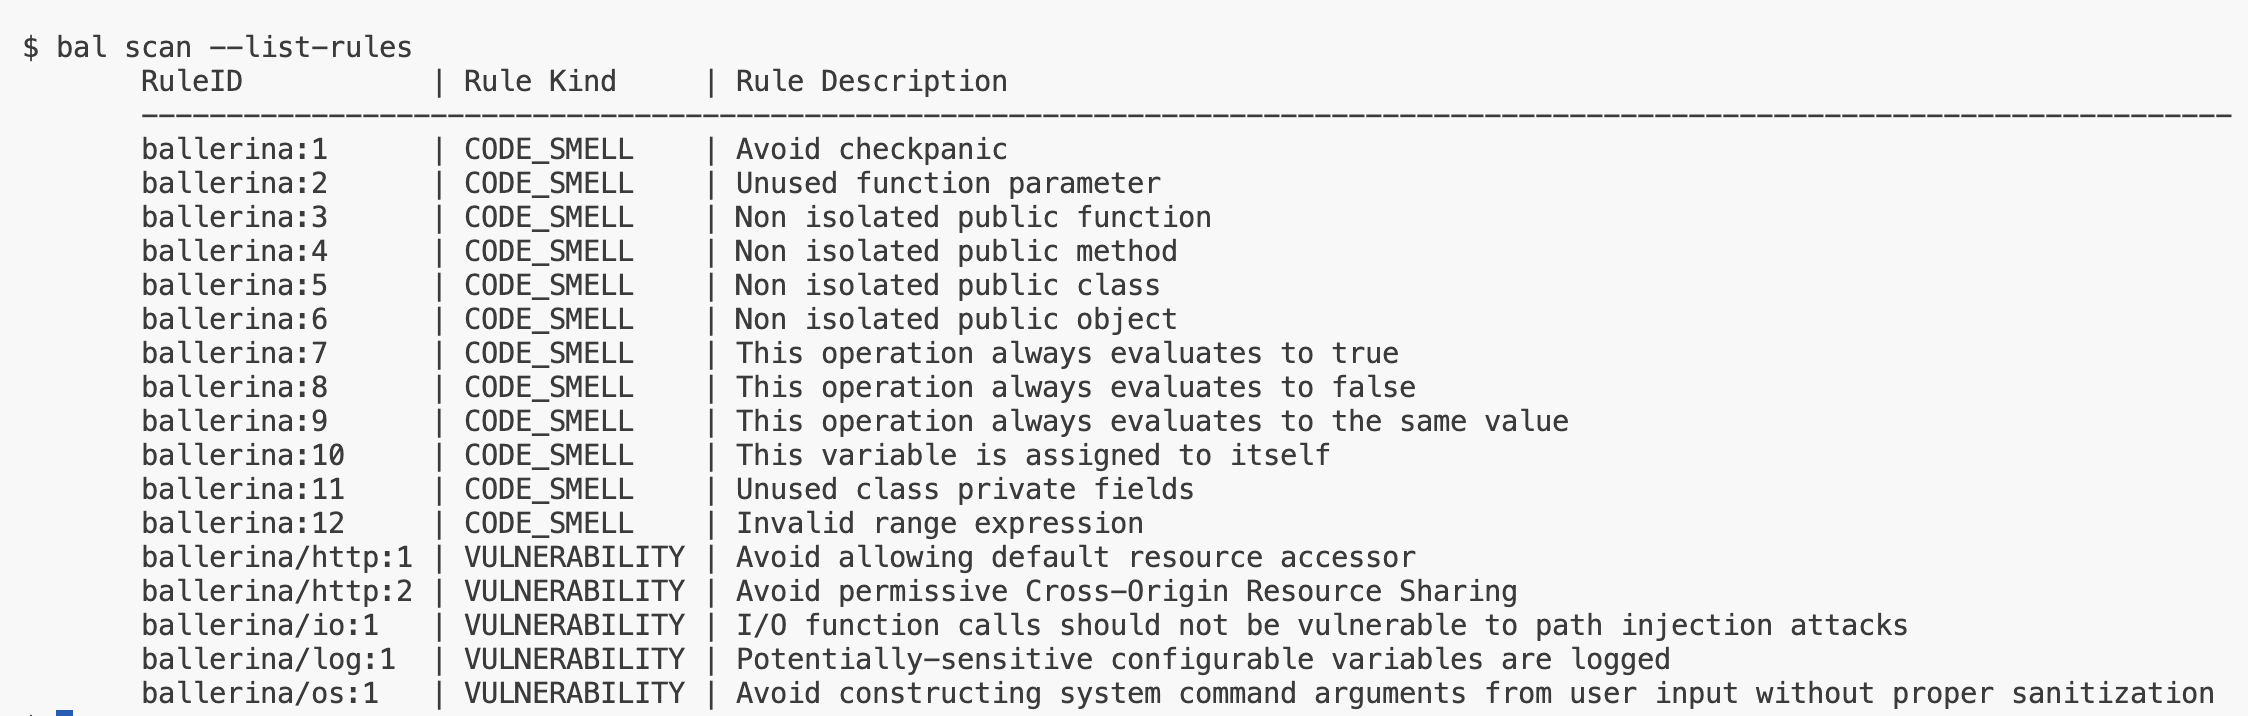
Note: The displayed rules are project-specific and determined by your project's dependencies.
Include specific rules
You can run the analysis for specific rules by using the --include-rules option.
This allows you to focus on particular areas of your codebase that you want to analyze.
$ bal scan --include-rules="ballerina:1"
You can also include multiple rules by listing them as a comma-separated string:
$ bal scan --include-rules="ballerina:1, ballerina/io:2"
Exclude specific rules
You can exclude specific rules from the analysis using the --exclude-rules option.
This is useful if you want to ignore certain rules that are not relevant to your project or if you have already
addressed them.
$ bal scan --exclude-rules="ballerina:1"
To exclude multiple rules, provide them as a comma-separated list:
$ bal scan --exclude-rules="ballerina:1, ballerina/io:2"
Platform integration
You can report the analysis results to platforms such as SonarQube using the --platforms option.
$ bal scan --platforms="sonarqube"
To specify more than one platform, separate them with commas:
$ bal scan --platforms="sonarqube, semgrep, codeql"
Publish static code analysis reports to SonarQube
SonarQube is a popular open-source platform for continuous inspection of code quality. It provides static code analysis, code coverage, and other features to help developers maintain clean, maintainable codebases. The Ballerina scan tool can be integrated with SonarQube to publish static code analysis reports, enabling seamless integration into your CI/CD pipelines.
This guide walks you through the process of configuring SonarQube and publishing Ballerina static code analysis reports.
Prerequisites
- SonarQube 9.9 LTA Community Edition installed.
- SonarScanner CLI 4.8.0 or later installed, and added to your system
PATH. - SonarQube Ballerina plugin, and SonarQube platform plugin downloaded.
Configure the SonarQube server
-
Install Java 17 in your machine.
-
If Java 17 is not the default Java installation, override it.
For Unix/macOS:
export SONAR_JAVA_PATH="path/to/java17_home/bin/java"For Windows:
setx SONAR_JAVA_PATH="path\to\java17_home\bin\java"
-
-
Setup SonarQube 9.9 LTA
- Download SonarQube 9.9 LTA from here.
- Extract the downloaded zip file.
-
Add the SonarQube Ballerina plugin.
- Download the latest Ballerina SonarQube plugin JAR.
- Place the JAR file into the
extensions/plugins/directory of your SonarQube installation.
-
Navigate to the appropriate
bin/<OS>/directory and run the SonarQube server.$ ./sonar.sh startYou can access the SonarQube dashboard at http://localhost:9000 once the server is up.
-
Create a new project in SonarQube.
- Log in to the SonarQube dashboard.
- Click on
Create Project. - Follow the prompts to set up your project.
-
Install and configure SonarScanner CLI.
- Download SonarScanner CLI from here.
- Add it to your system
PATH. - Ensure
sonar.host.urlis set correctly (either via a properties file or CLI parameter).
Configure the Ballerina project
-
Download the SonarQube platform plugin.
-
Create a
sonar-project.propertiesfile at the root of your Ballerina project with the following content.sonar.projectKey=<your-project-key> sonar.projectName=<your-project-name> -
Create a Scan.toml at the root of your Ballerina project. Add additional SonarQube configurations by referencing the
sonar-project.propertiesfile.[[platform]] name = "sonarqube" path = "<path-to-sonar-platform-plugin>" sonarProjectPropertiesPath = "<path-to-sonar-project.properties>"
Publish reports to SonarQube
-
Link a ballerina source repo to the SonarQube server from a DevOps platform or manually.
-
Authenticate using a token.
-
Generate a token from the
My Account->Securitysection in the SonarQube UI. -
Set the token as an environment variable.
For Unix/macOS:
$ export SONAR_TOKEN=<your-token>For Windows:
$ set SONAR_TOKEN=<your-token>
-
-
Run the scan tool to publish the reports to SonarQube.
$ bal scan
After the scan
- Once the scan completes, navigate to your project in the SonarQube dashboard.
- View issues, vulnerabilities, code smells, and other static analysis results directly from the SonarQube UI.