- Write a RESTful API with Ballerina
- Write a gRPC service with Ballerina
- Write a GraphQL API with Ballerina
- Work with data using queries in Ballerina
- Build a data service in Ballerina
- Build a Change Data Capture (CDC) service in Ballerina
- Work with Large Language Models (LLMs) using natural expressions
- Deploy Ballerina on Kubernetes
- Manage data persistence with bal persist
- Create your first connector with Ballerina
Tracing provides information regarding the roundtrip of a service invocation based on the concept of spans, which are structured in a hierarchy based on the cause and effect concept.
A trace can spread across several services that can be deployed in several nodes, depicting a high-level view of interconnections among services as well, hence coining the term distributed tracing.
A span is a logical unit of work, which encapsulates a start and end time as well as metadata to give more meaning to the unit of work being completed. For example, a span representing a client call to an HTTP endpoint would give the user the latency of the client call and metadata like the HTTP URL being called, and the HTTP method used. If the span represents an SQL client call, the metadata would include the query being executed.
Tracing gives the user a high-level view of how a single service invocation is processed across several distributed microservices.
- Identify service bottlenecks - The user can monitor the latencies and identify when a service invocation slows down, pinpoint where the slowing down happens (by looking at the span latencies), and take action to improve the latency.
- Error identification - If an error occurs during the service invocation, it will show up in the list of traces. The user can easily identify where the error occurred and information of the error will be attached to the relevant span as metadata.
Ballerina supports OpenTelemetry standards by default. This means that Ballerina services can be traced using OpenTelemetry implementations like Jaeger.
Configure advanced tracing
Tracing can be enabled in Ballerina with the few configurations mentioned above in the Observe a Ballerina service section. This section mainly focuses on the configuration options with the description and possible values.
A sample configuration that enables tracing and uses Jaeger as the tracer is provided below.
[ballerina.observe] tracingEnabled=true tracingProvider="jaeger"
The table below provides the descriptions of each configuration option and possible values that can be assigned.
| Configuration key | Description | Default value | Possible values |
|---|---|---|---|
| ballerina.observe.tracingEnabled | Whether tracing is enabled (true) or disabled (false) | false | true or false |
| ballerina.observe.tracingProvider | The tracer name, which implements the tracer interface. | choreo | jaeger or the name of the tracer of any custom implementation. |
Use the Jaeger extension
Below are the sample configuration options that are available to support Jaeger as the tracer provider in Ballerina.
[ballerina.observe] tracingEnabled=true tracingProvider="jaeger" [ballerinax.jaeger] agentHostname="localhost" agentPort=4317 samplerType="const" samplerParam=1.0 reporterFlushInterval=2000 reporterBufferSize=1000
The table below provides the descriptions of each configuration option and possible values that can be assigned.
| Configuration key | Description | Default value | Possible values |
|---|---|---|---|
| ballerina.observe. agentHostname | Hostname of the Jaeger agent | localhost | IP or hostname of the Jaeger agent. If it is running on the same node as Ballerina, it can be localhost. |
| ballerina.observe. agentPort | Port of the Jaeger agent | 4317 | The port on which the Jaeger agent is listening. |
| ballerina.observe. samplerType | Type of the sampling methods used in the Jaeger tracer. | const | const, probabilistic, or ratelimiting. |
| ballerina.observe. samplerParam | It is a floating value. Based on the sampler type, the effect of the sampler param varies | 1.0 | For const 0 (no sampling) or 1 (sample all spans), for probabilistic 0.0 to 1.0, for ratelimiting any positive integer (rate per second). |
| ballerina.observe. reporterFlushInterval | The Jaeger client will be sending the spans to the agent at this interval. | 2000 | Any positive integer value. |
| ballerina.observe. reporterBufferSize | Queue size of the Jaeger client. | 2000 | Any positive integer value. |
Set up the external systems for tracing
You can configure Ballerina to support distributed tracing with Jaeger. This section focuses on configuring Jaeger with Docker as a quick installation.
Set up the Jaeger server
Tip: There are many possible ways to deploy Jaeger. For more information, see Jaeger Deployment. The easiest option is to use executable binaries listed in Downloads.
-
Install Jaeger via Docker and start the Docker container by executing the command below.
$ docker run -d -p 13133:13133 -p 16686:16686 -p 4317:4317 jaegertracing/all-in-one -
Go to http://localhost:16686 and load the web UI of Jaeger to make sure it is functioning properly. You can select the service which you need tracing information find traces.
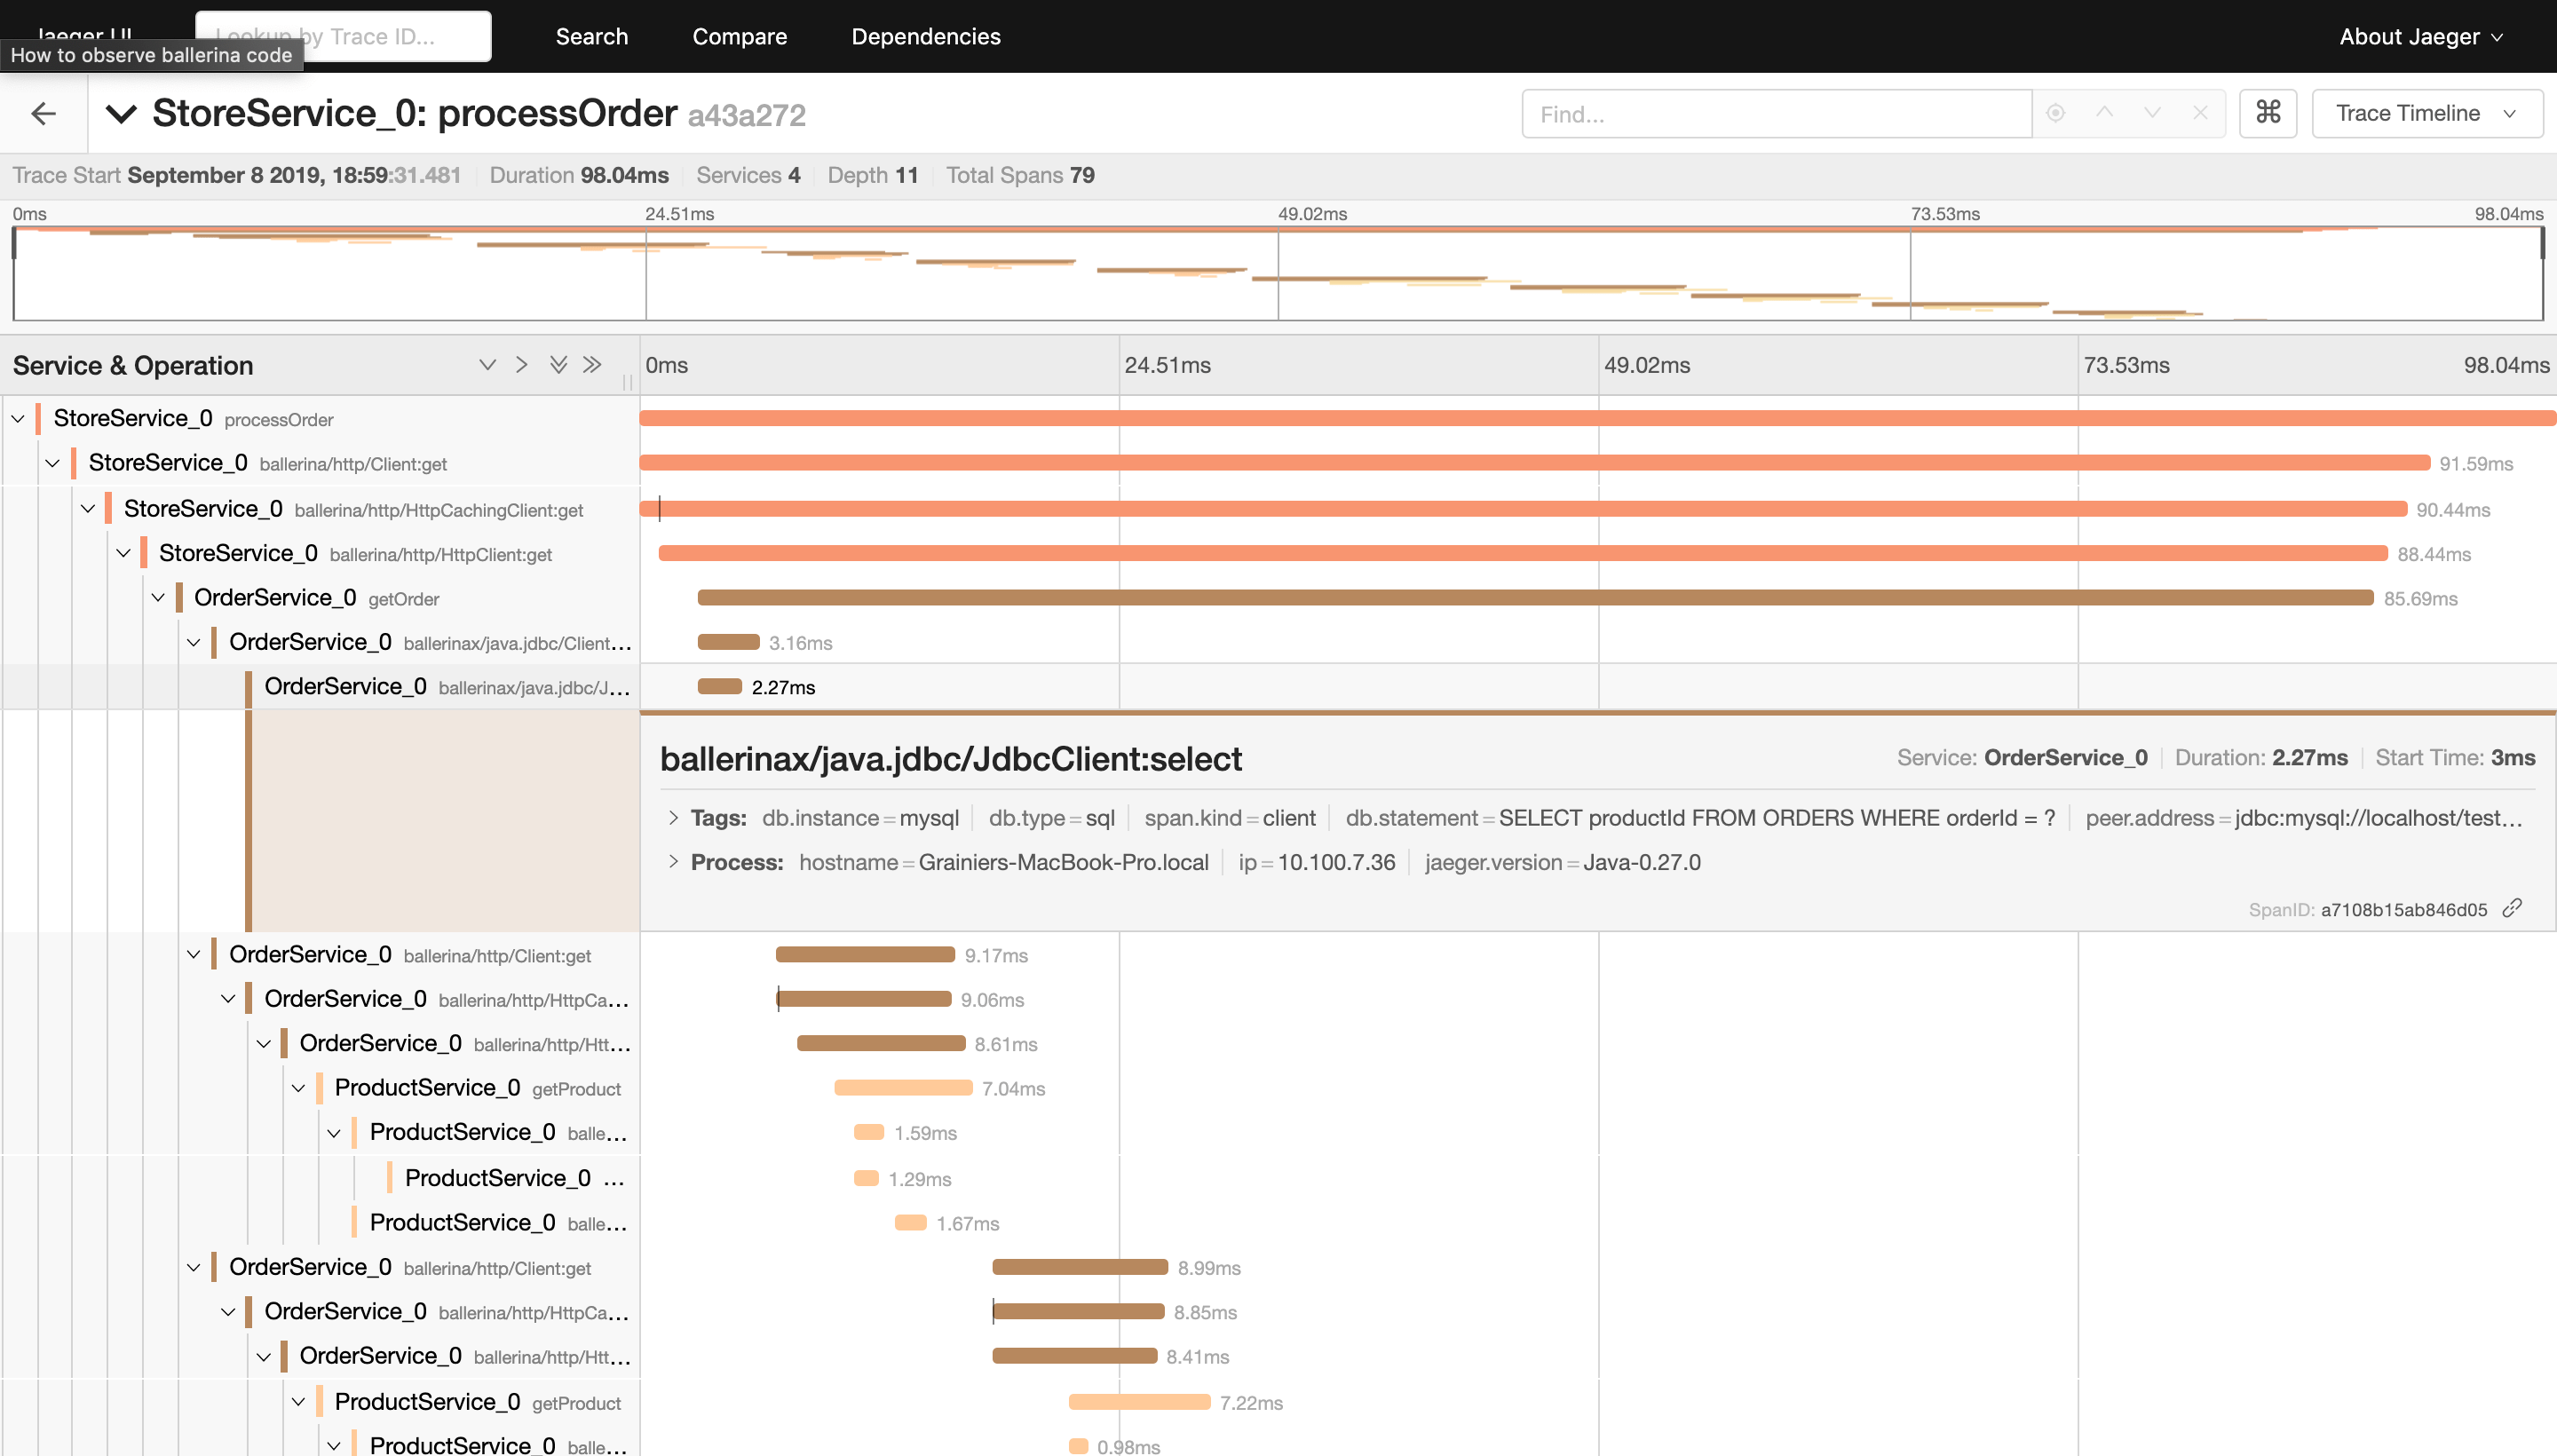
The image below is the sample tracing information you can see in Jaeger.
