- Write a RESTful API with Ballerina
- Write a gRPC service with Ballerina
- Write a GraphQL API with Ballerina
- Work with data using queries in Ballerina
- Build a data service in Ballerina
- Build a Change Data Capture (CDC) service in Ballerina
- Work with Large Language Models (LLMs) using natural expressions
- Deploy Ballerina on Kubernetes
- Manage data persistence with bal persist
- Create your first connector with Ballerina
Metrics help to monitor the runtime behavior of a service. Therefore, metrics are a vital part of monitoring Ballerina services.
To support Prometheus as the metrics reporter, an HTTP endpoint starts with the context
of /metrics in default port 9797 when starting the Ballerina service.
Configure advanced metrics
You can set up prometheus for your Ballerina project using configuration similar to the following in your Config.toml file.
[ballerina.observe] metricsEnabled=true metricsReporter="prometheus" [ballerinax.prometheus] port=9797 host="0.0.0.0"
| Configuration key | Description | Default value | Possible values |
|---|---|---|---|
| ballerina.observe. metricsEnabled | Whether metrics monitoring is enabled (true) or disabled (false) | false | true or false |
| ballerina.observe. metricsReporter | Reporter name that reports the collected Metrics to the remote metrics server. This is only required to be modified if a custom reporter is implemented and needs to be used. | "" | prometheus or if any custom implementation, the name of the reporter. |
| ballerinax.prometheus. port | The value of the port to which the '/metrics' service will bind to. This service will be used by Prometheus to scrape the information of the Ballerina service. | 9797 | Any suitable value for port 0 - 0 - 65535. However, within that range, ports 0 - 1023 are generally reserved for specific purposes, therefore it is advisable to select a port without that range. |
| ballerinax.prometheus. host | The name of the host to which the '/metrics' service will bind to. This service will be used by Prometheus to scrape the information of the Ballerina service. | 0.0.0.0 | IP or Hostname or 0.0.0.0 of the node in which the Ballerina service is running. |
Set up the external systems for metrics
There are mainly two systems involved in collecting and visualizing the metrics. Prometheus is used to collect the metrics from the Ballerina service while Grafana can be used to connect to Prometheus and visualize the metrics on the dashboard.
Set up Prometheus
Prometheus is used as the monitoring system, which pulls out the metrics collected from the Ballerina /metrics service. This section focuses on the quick installation of Prometheus with Docker and the configuration required to
collect metrics from the Ballerina service with the default configurations. Follow the steps below to configure
Prometheus.
Tip: There are many other ways to install Prometheus and you can find possible options from the installation guide. The easiest option is to use precompiled binaries listed in Downloads.
-
Create a
prometheus.ymlfile in a directory. -
Add the following content to the
prometheus.ymlfile.global: scrape_interval: 15s evaluation_interval: 15s scrape_configs: - job_name: 'prometheus' static_configs: - targets: ['a.b.c.d:9797']Here, the
'a.b.c.d:9797'targets should contain the host and port of the/metricsservice that is exposed from Ballerina for metrics collection. Add the IP of the host in which the Ballerina service is running asa.b.c.dand its port (default9797). If you need more information, go to the Prometheus documentation.If your Ballerina service is running on localhost and Prometheus in a Docker container, add the target as
host.docker.internal:9797to access the localhost from Docker. -
Start the Prometheus server in a Docker container with the command below.
$ docker run -p 19090:9090 -v <path_to_prometheus.yml>:/etc/prometheus/ prom/prometheus -
Go to http://localhost:19090/ and check whether you can see the Prometheus graph. Ballerina metrics should appear in Prometheus graph's metrics list when the Ballerina service is started. You can also use the following command to get the metrics.
$ curl http://localhost:9797/metrics
Set up Grafana
Let’s use Grafana to visualize metrics in a dashboard. For this, we need to install Grafana and configure Prometheus as a data source. Follow the steps below to configure Grafana.
-
Start Grafana as a Docker container with the command below.
$ docker run -d --name=grafana -p 3000:3000 grafana/grafanaFor more information, go to Grafana in Docker Hub.
-
Go to http://localhost:3000/ to access the Grafana dashboard running on Docker.
-
Login to the dashboard with the default user, username:
adminand password:admin -
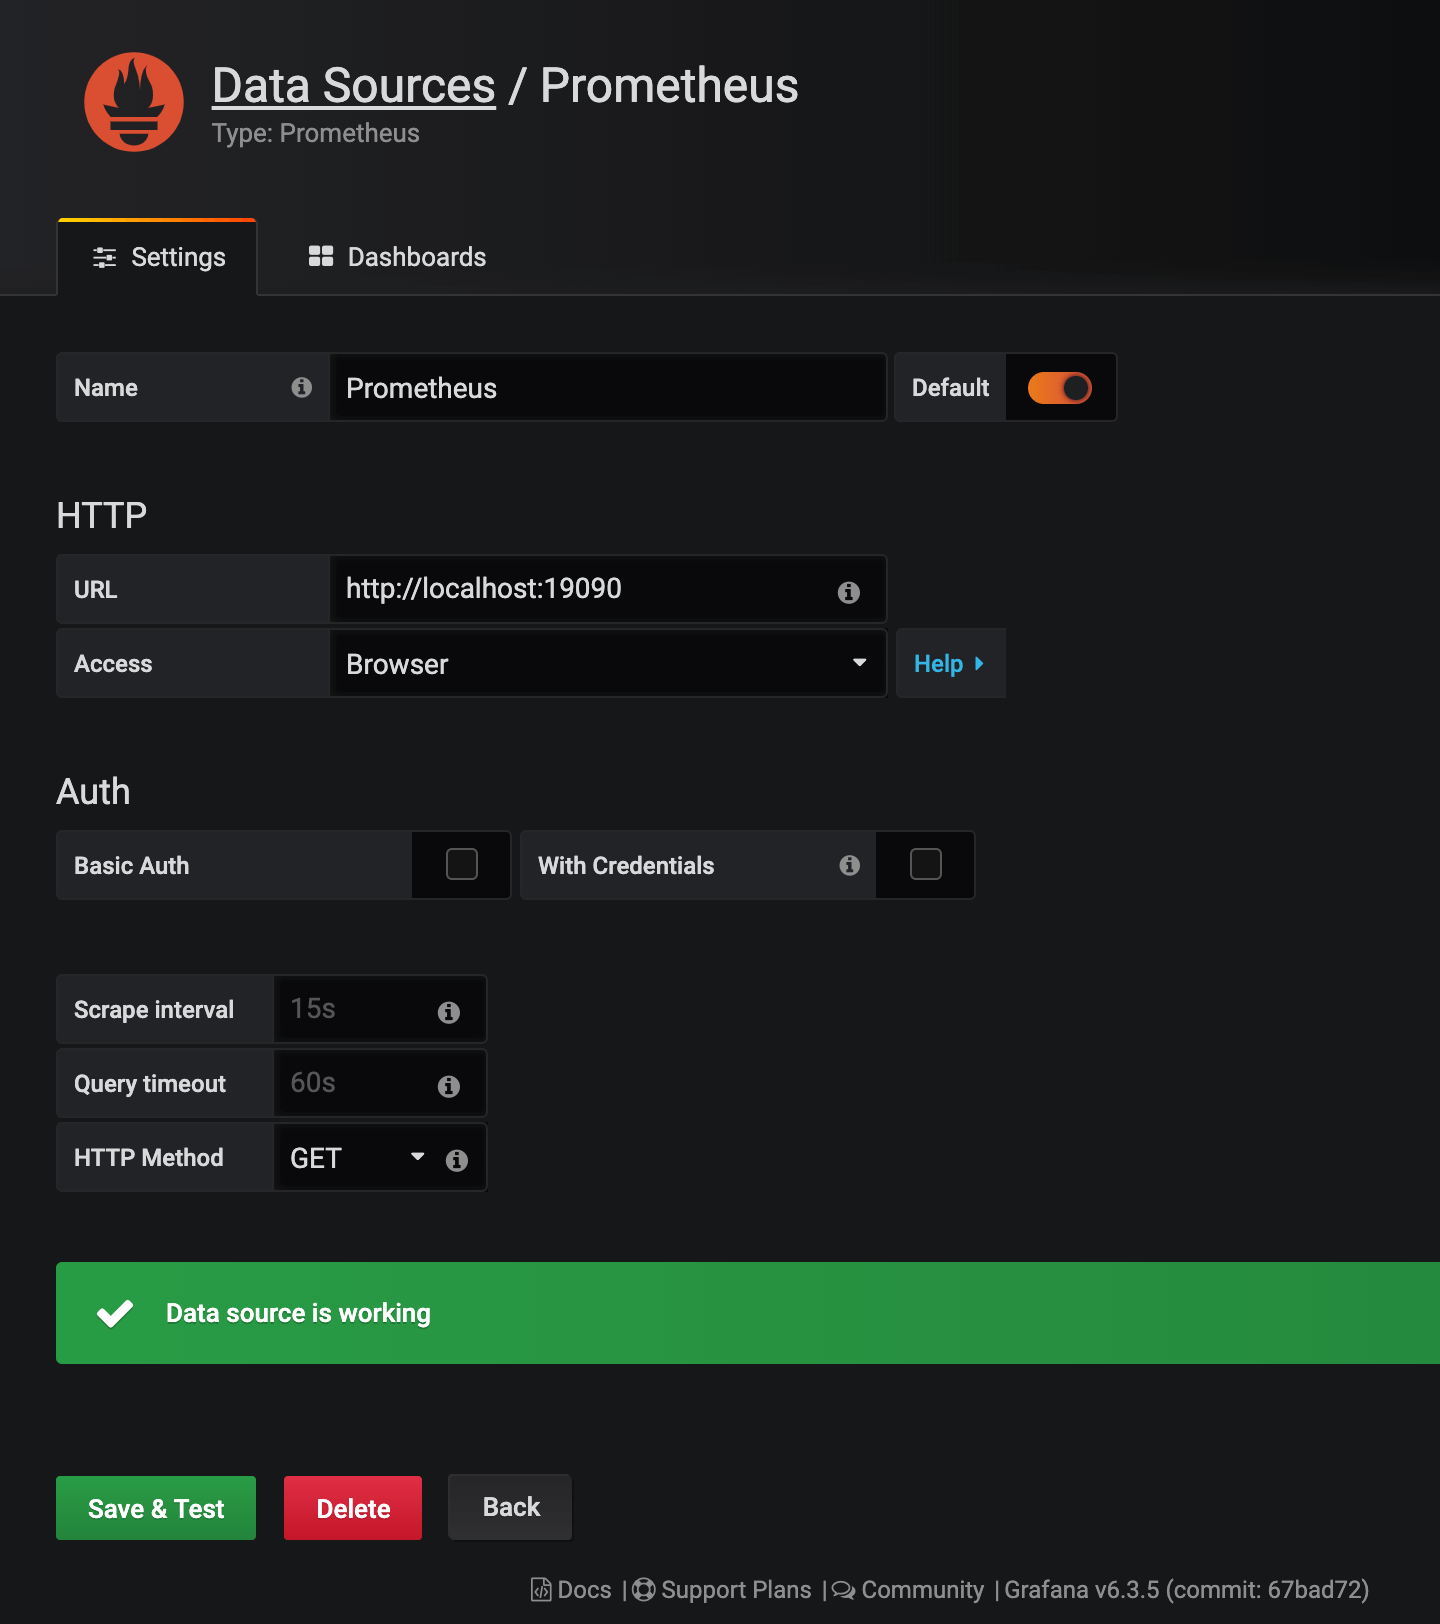
Add Prometheus as a data source with
Browseraccess configuration as provided below.
-
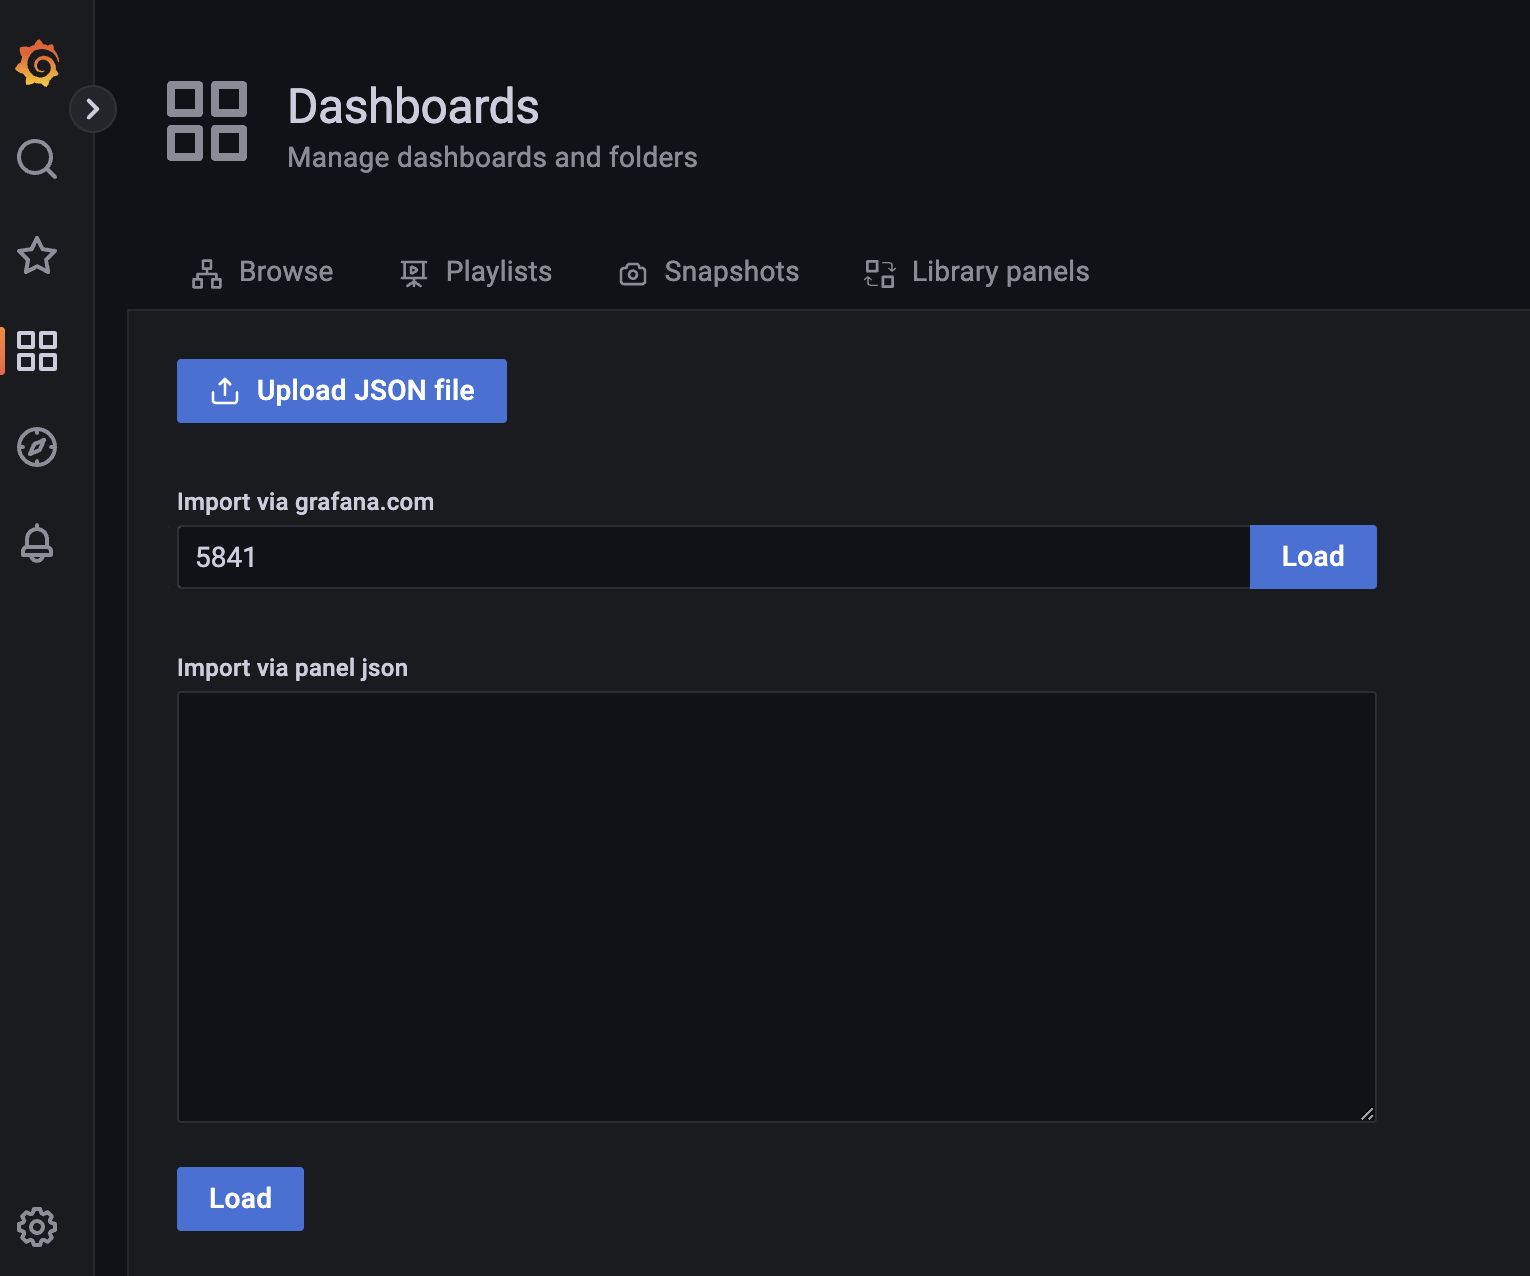
Import the Grafana dashboard designed to visualize Ballerina metrics from https://grafana.com/dashboards/5841 as shown below.

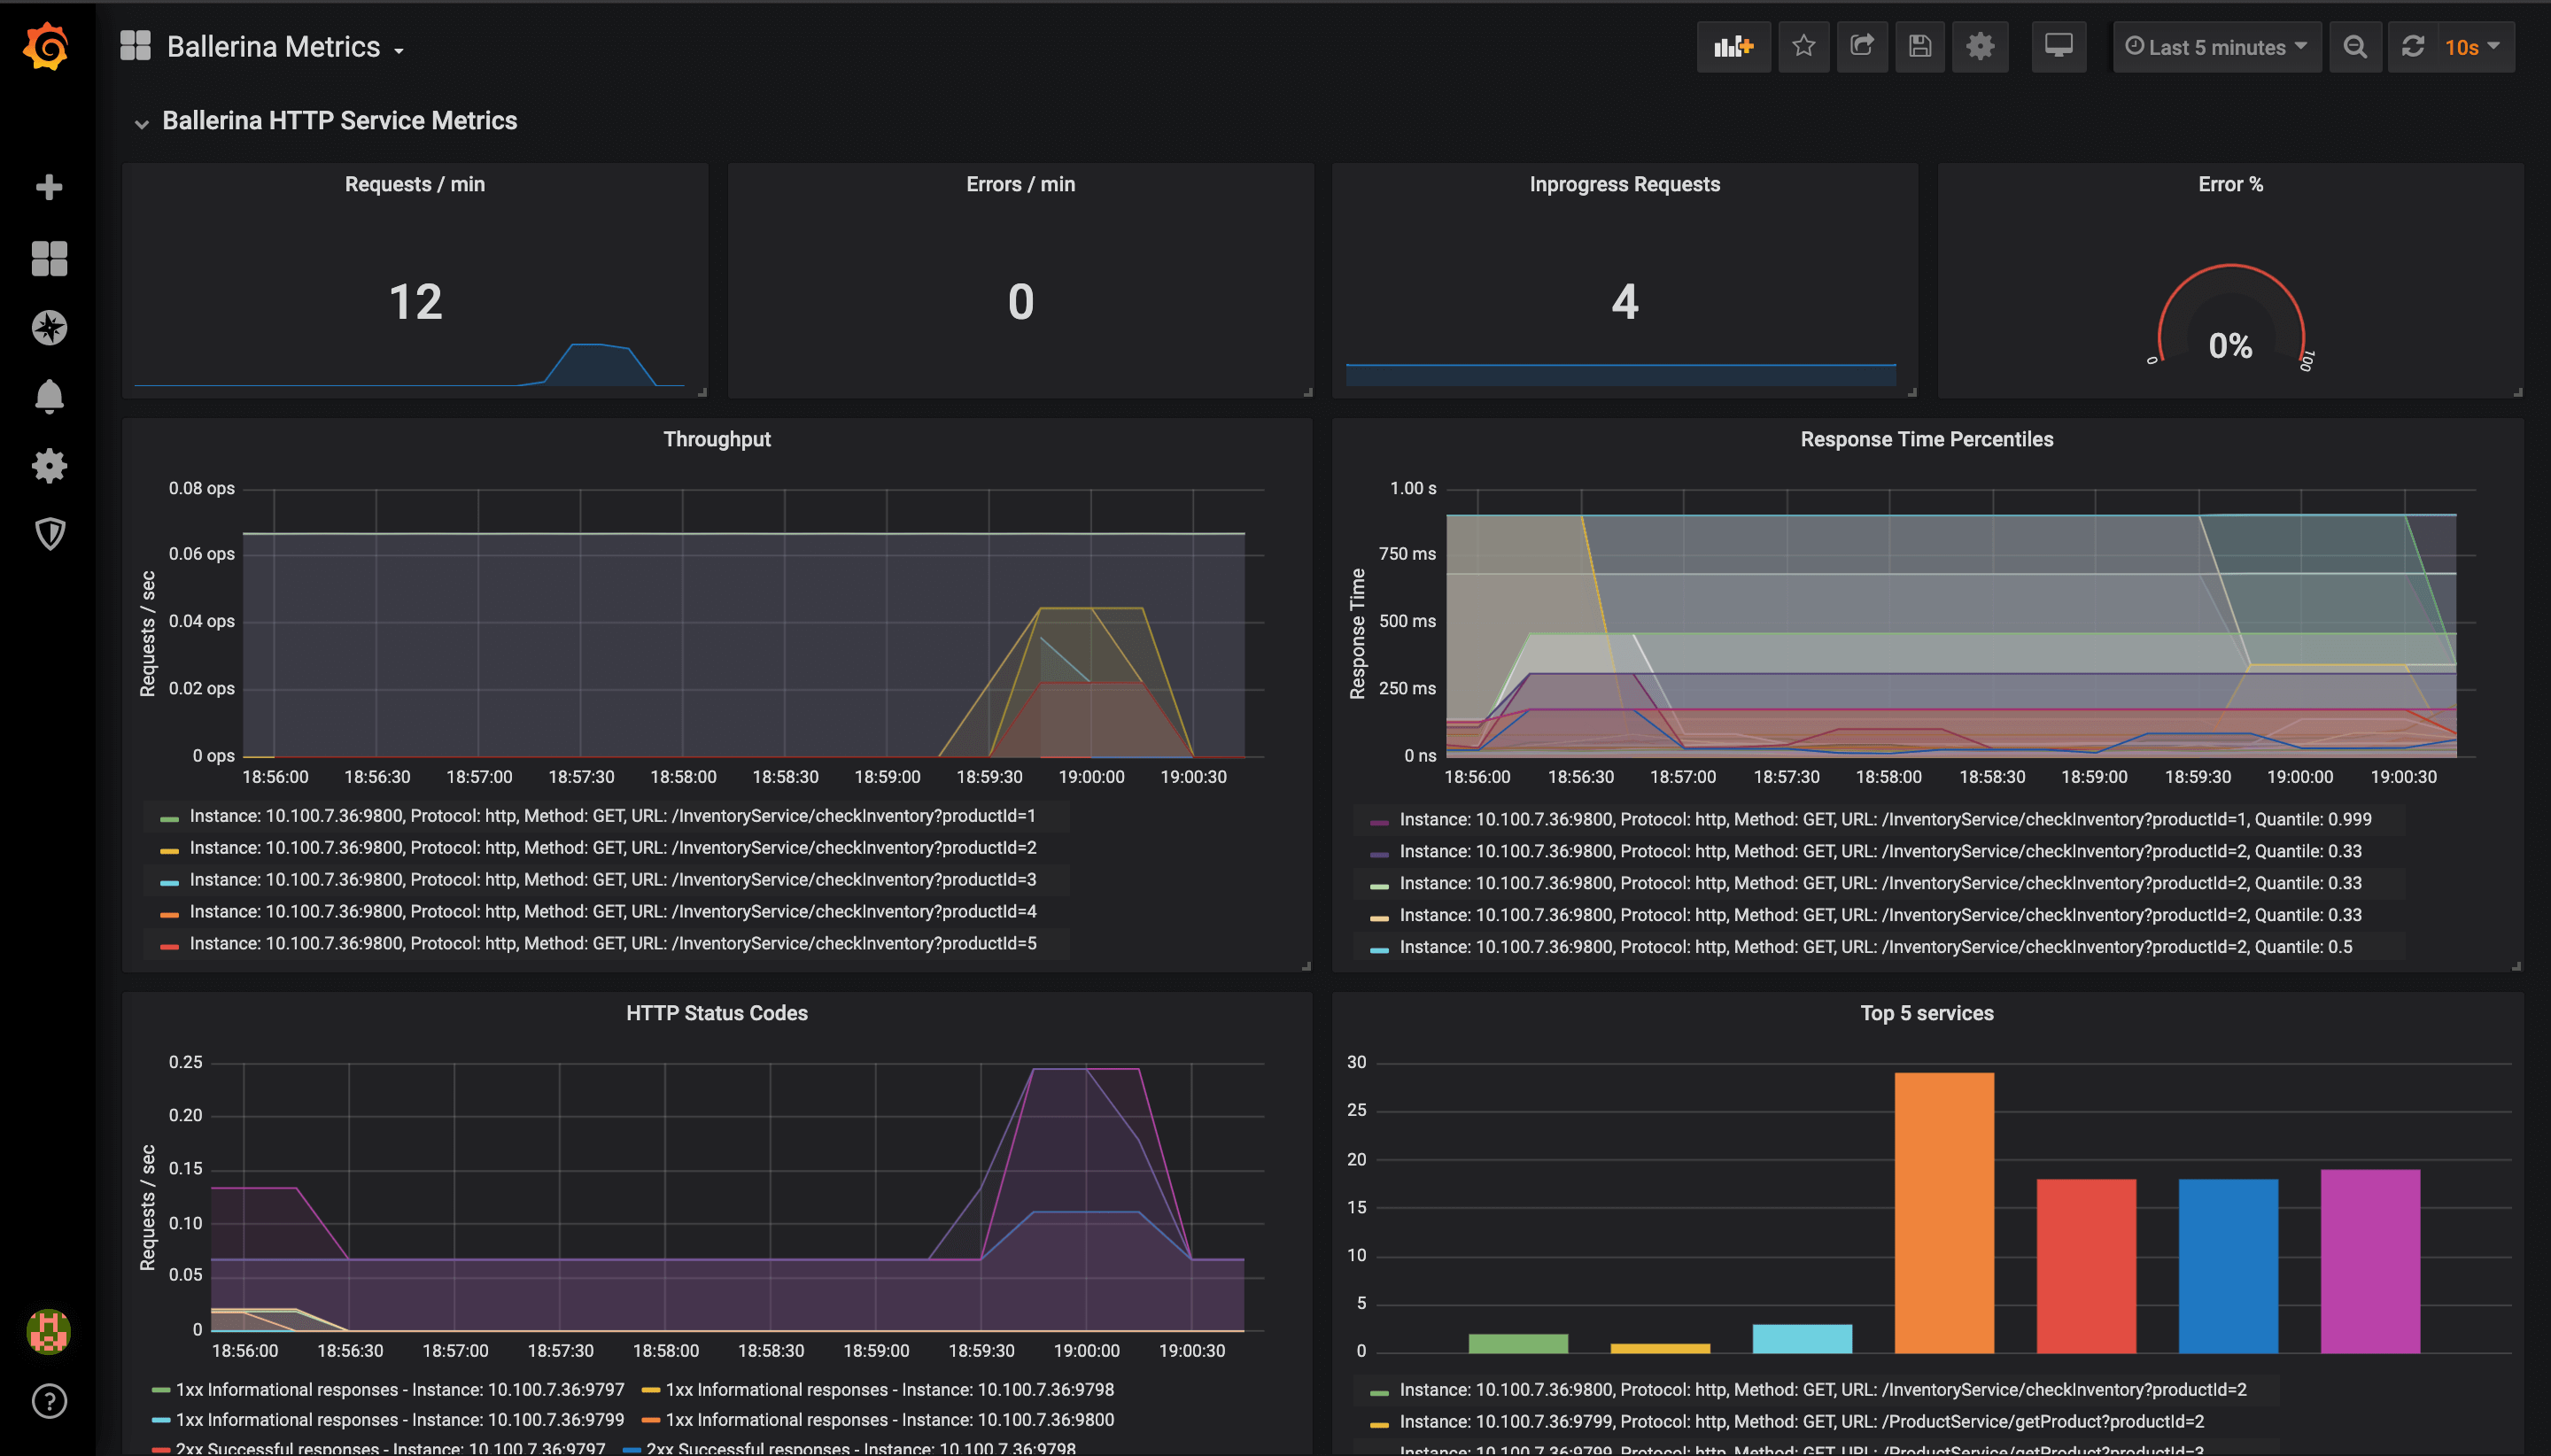
This dashboard consists of service and client invocation level metrics in near real-time view.
The Ballerina HTTP Service Metrics Dashboard Panel will be as shown below.
