Back to VS Code home
The Entity Diagram View can capture entities defined in your data model, their primary keys, and how they are related to each other.
The visual representation provided by the Ballerina VS Code extension supports the rendering of the entity diagram for bal persist model definitions. The bal persist enables seamless data persistence by allowing you to define the data model and utilize the generated client API. For more information, see Bal persist overview.
This visualization feature allows you to view the data model in a clear diagrammatic representation. By visualizing the relationships between entities, you can gain a comprehensive understanding of the structure and associations within your data model and also validate the accuracy of the model.
Access the Entity Relationship Diagram View
There are two methods for switching to the graphical mode and accessing the Entity Diagram View using the VS Code extension as shown below.
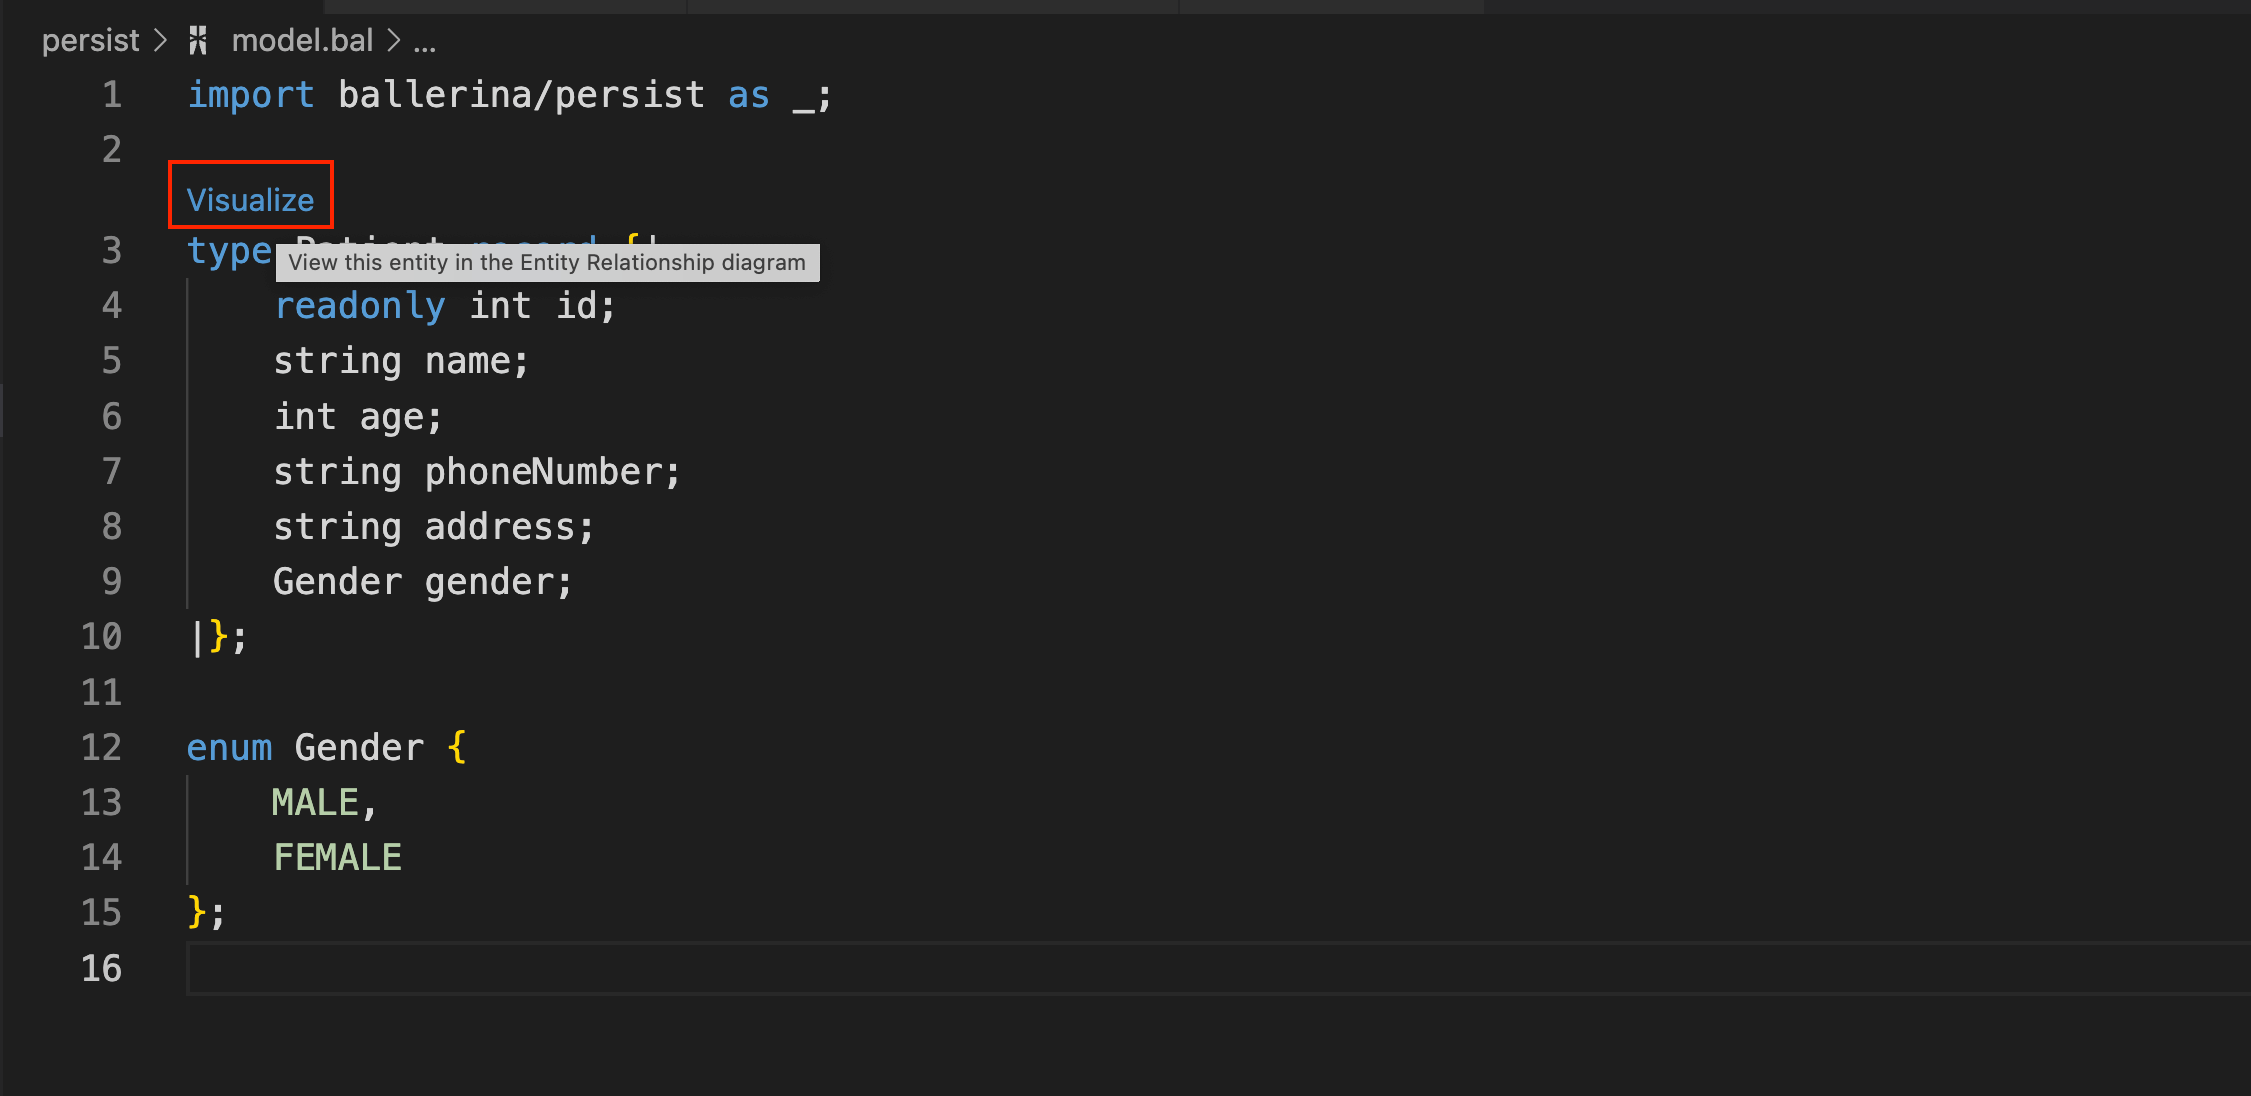
Via the CodeLens
Click the Visualize CodeLens that appears in the editor.
Info: This Visualize CodeLens appears only for the entities defined in the model definition file inside the
persistdirectory of your Ballerina project. For instructions on creating the data model definition, see Model your data.
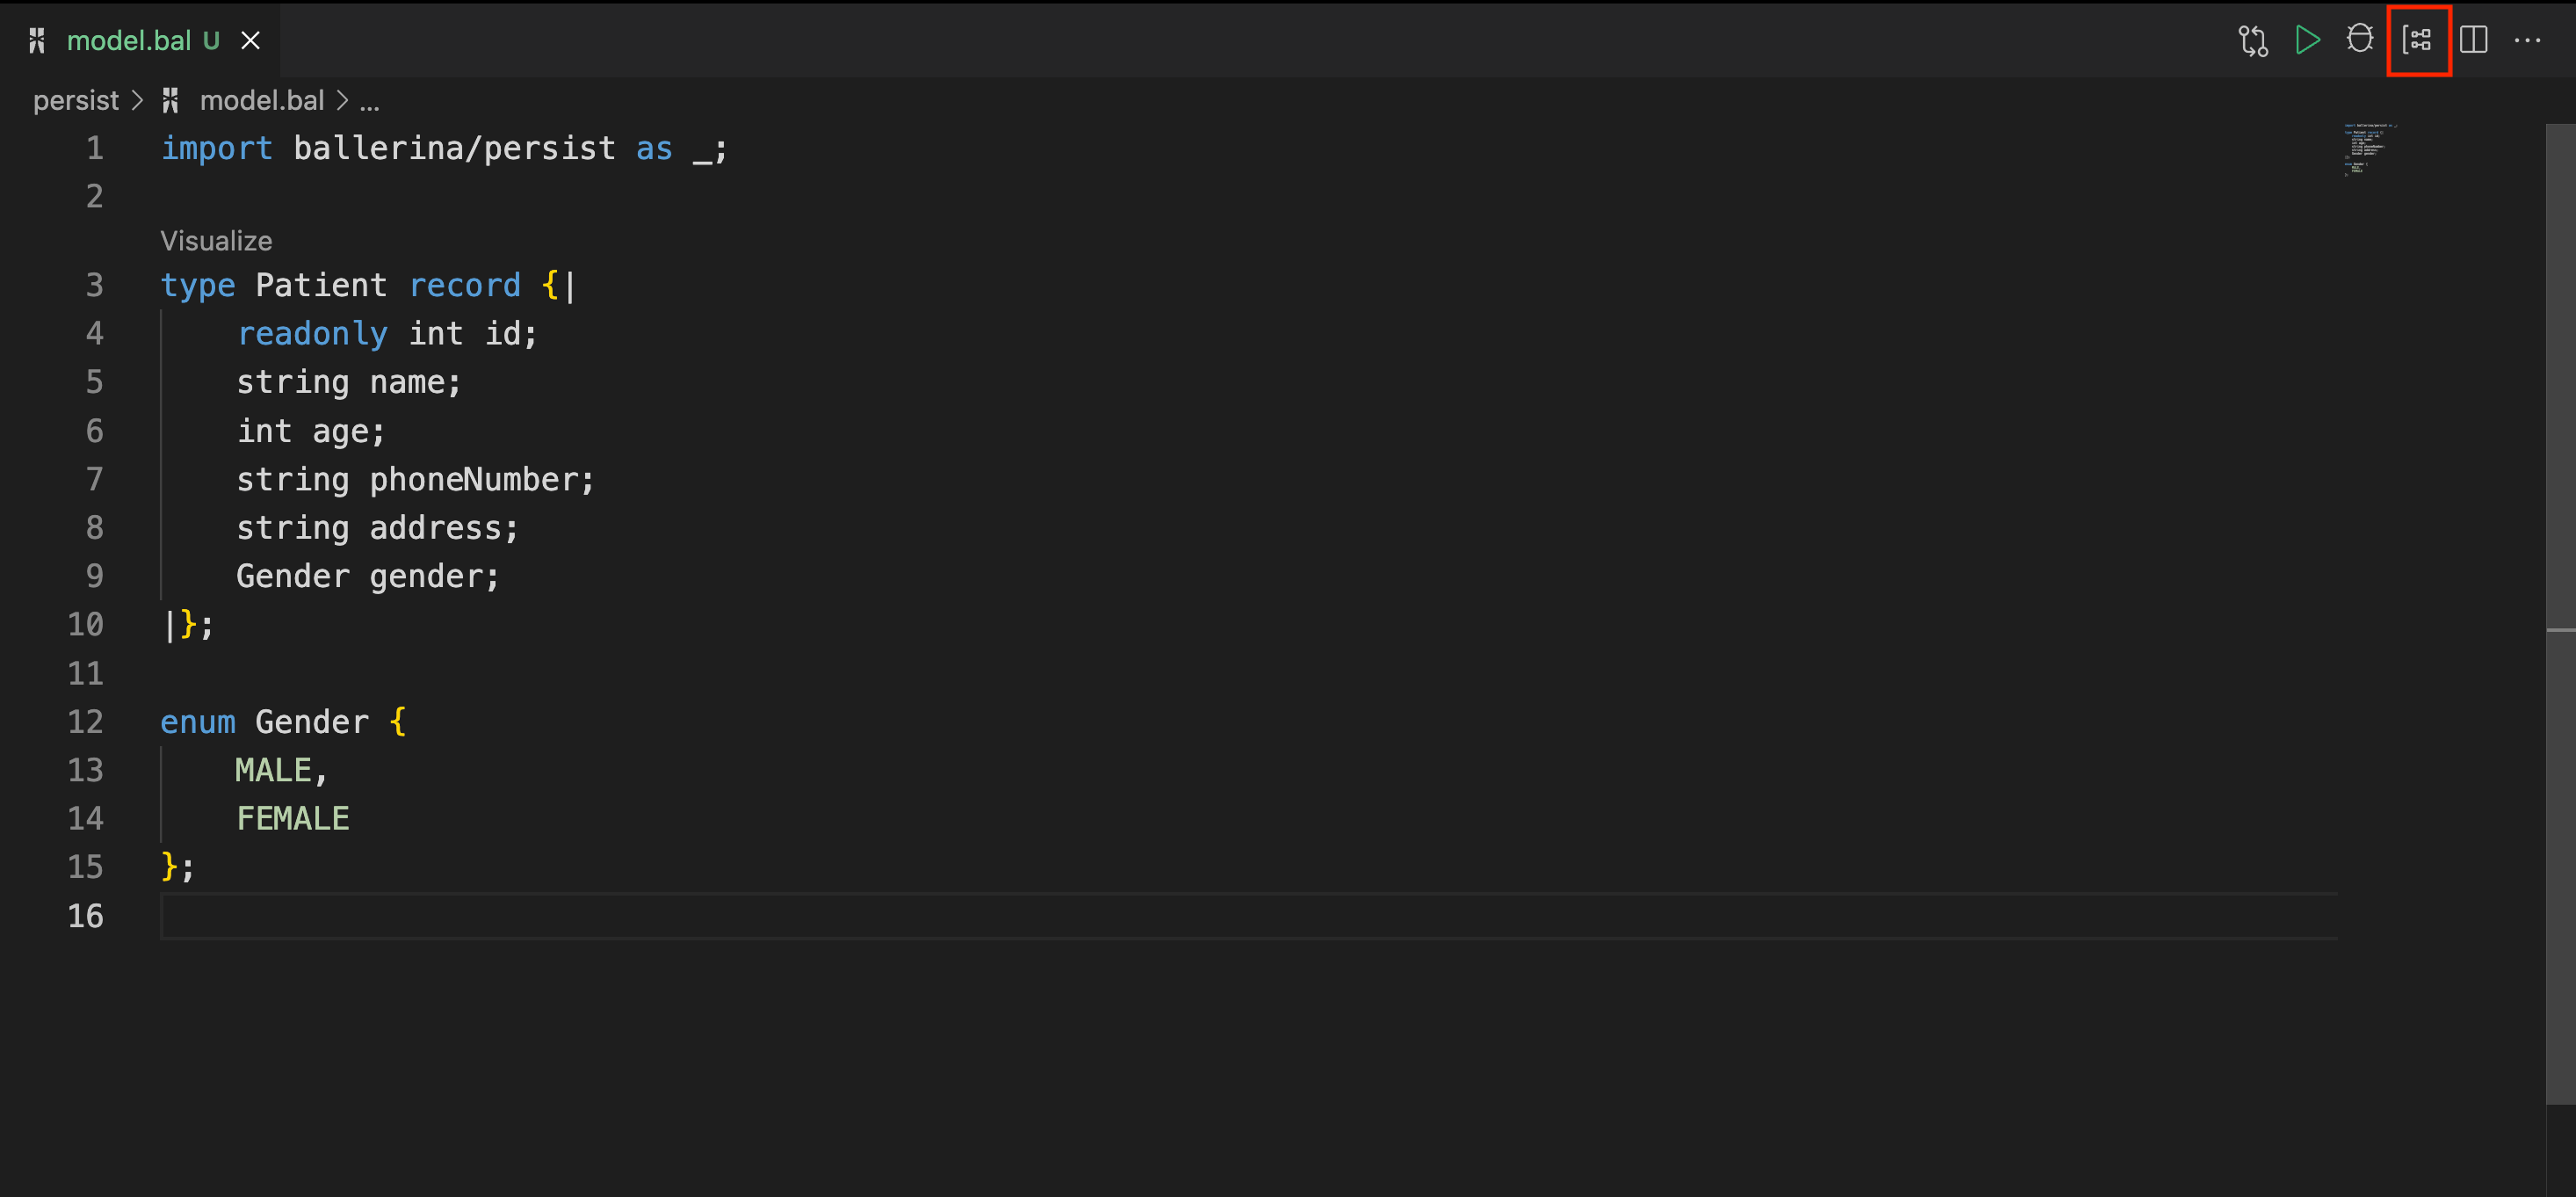
Via the editor group button
Click the Entity Relationship Diagram button in the editor group.
Info: This button appears if you open the model definition file inside the
persistdirectory of your Ballerina project. For instructions on creating the data model definition, see Model your data.
Shown below is the code editor and graphical editor in the split view. The graphical mode is focused on the entity defined in the model definition file.
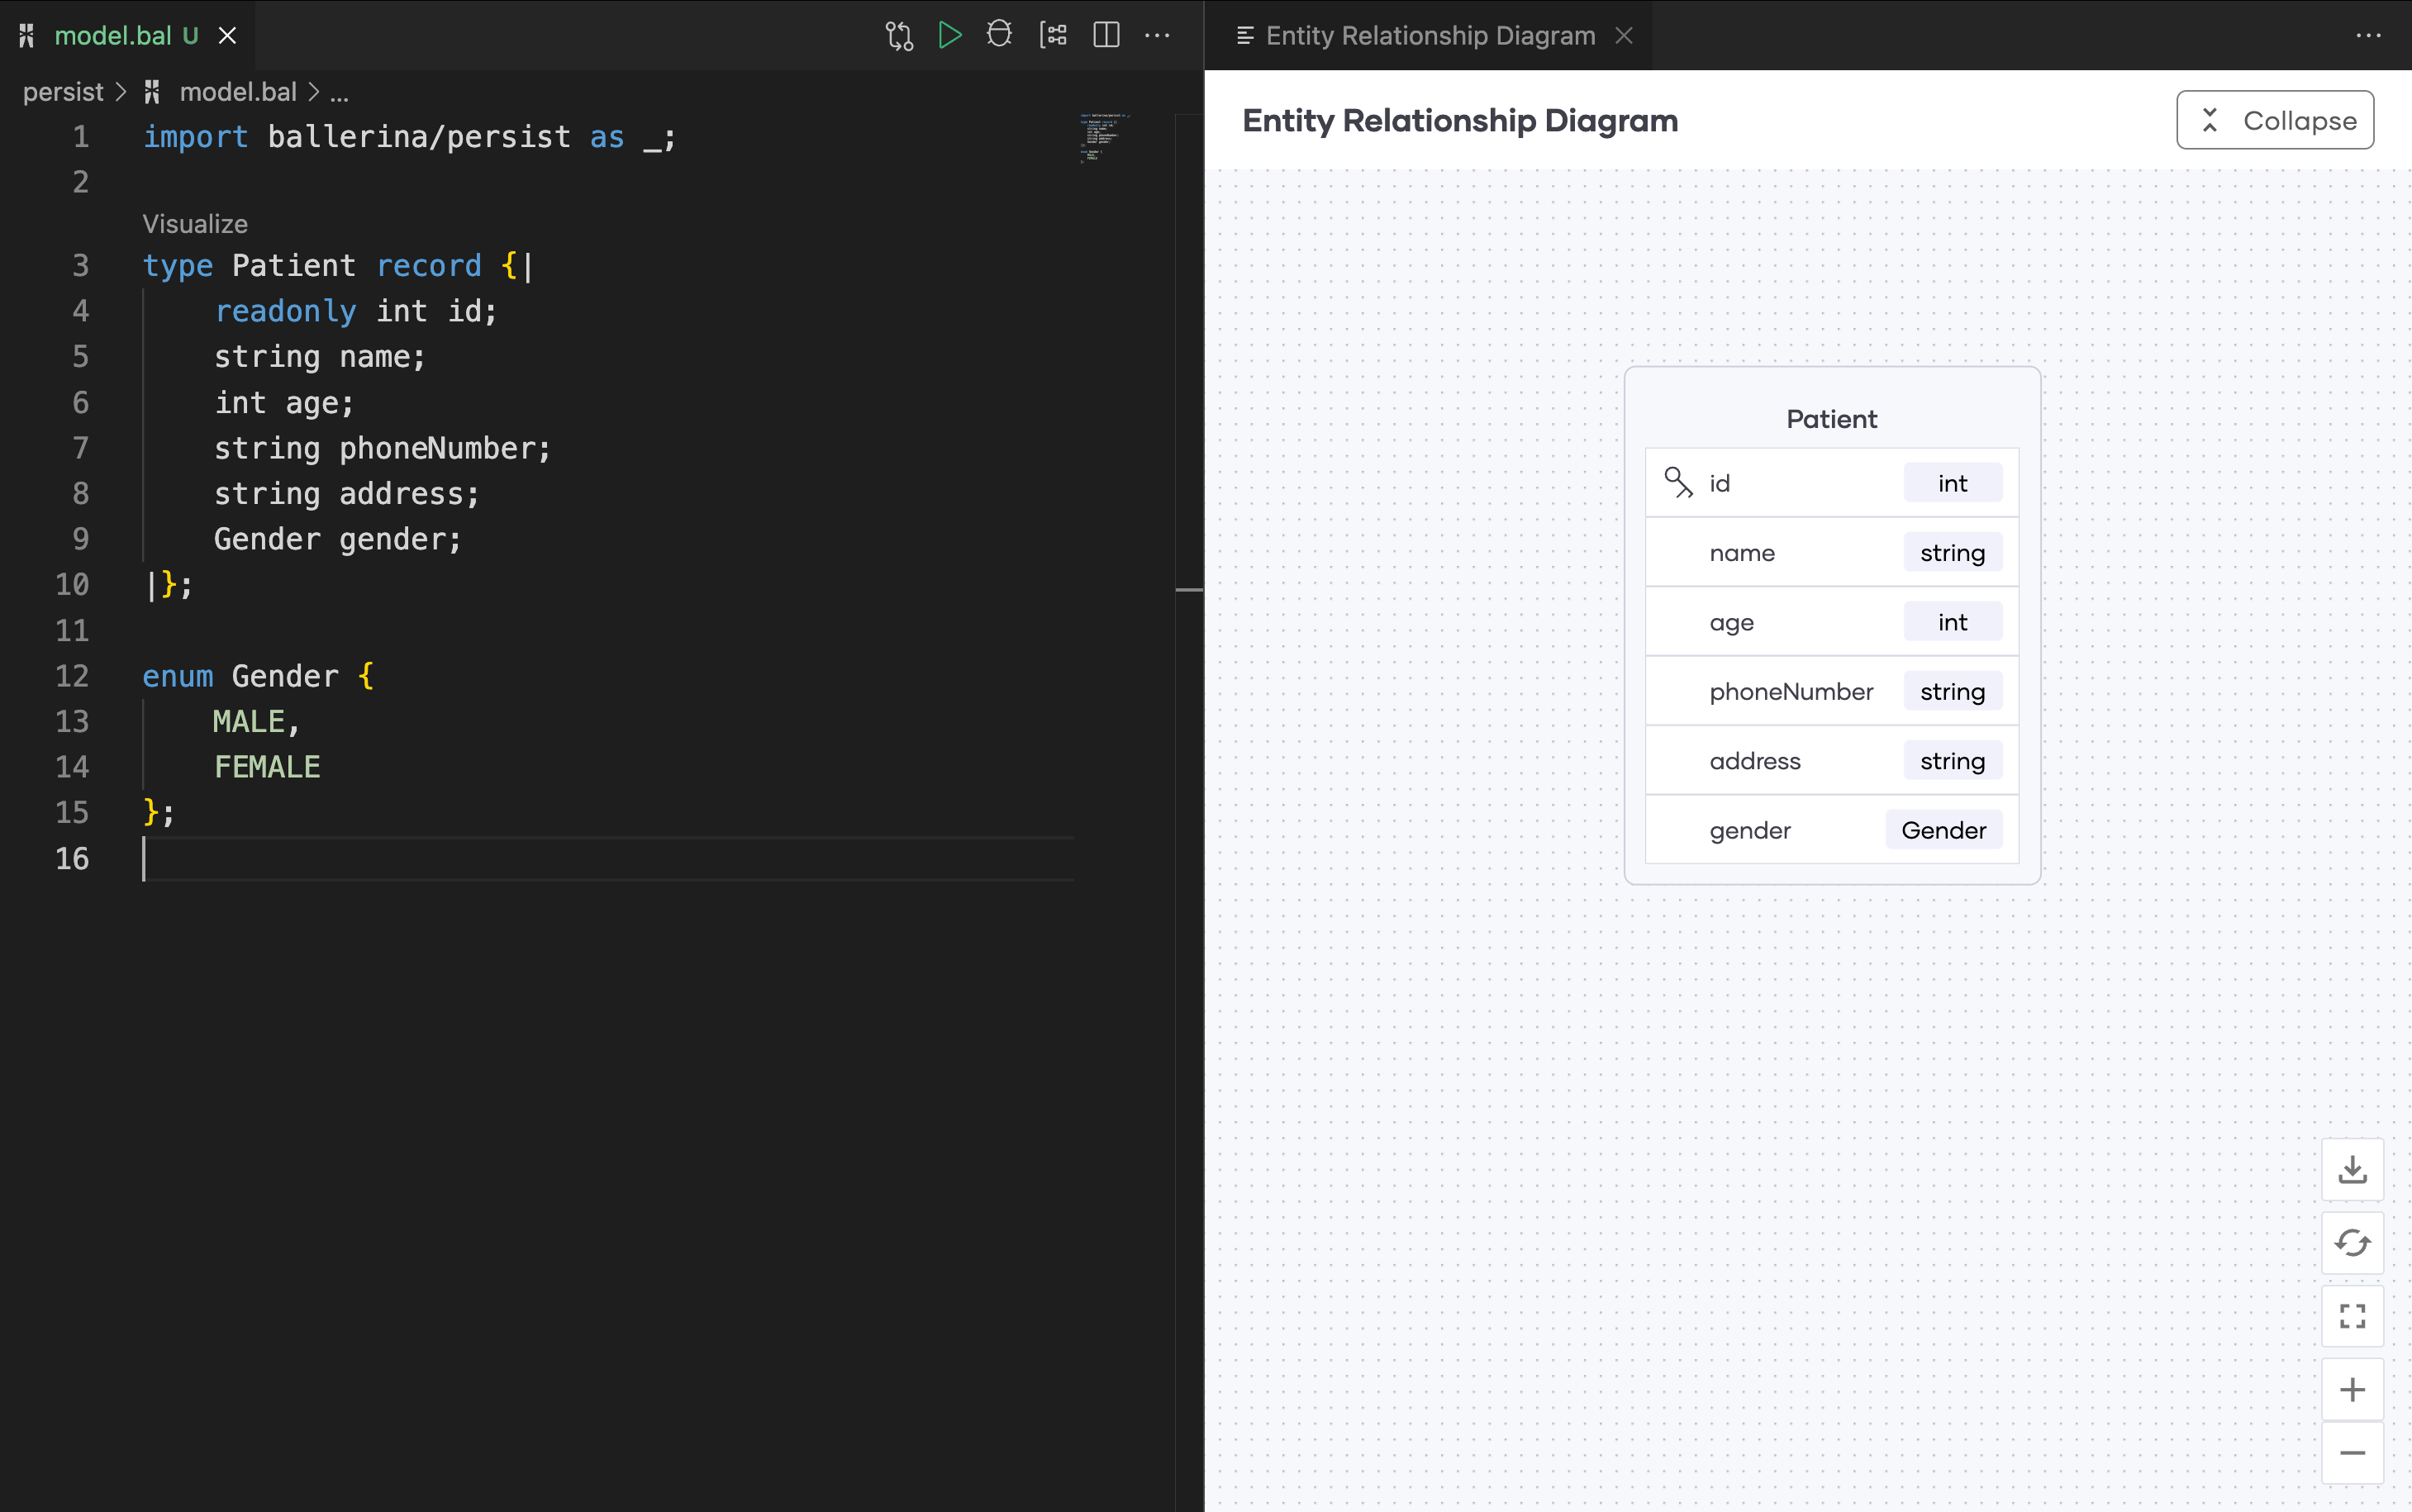
Graphical representation of the data model
The graphical representation of the relationships between the entities is a connection between the relation fields. The cardinality of the ER diagram will change depending on the type of relationship, which exists between the entities (i.e., whether it is a 1:1 relationship or 1:n relationship).
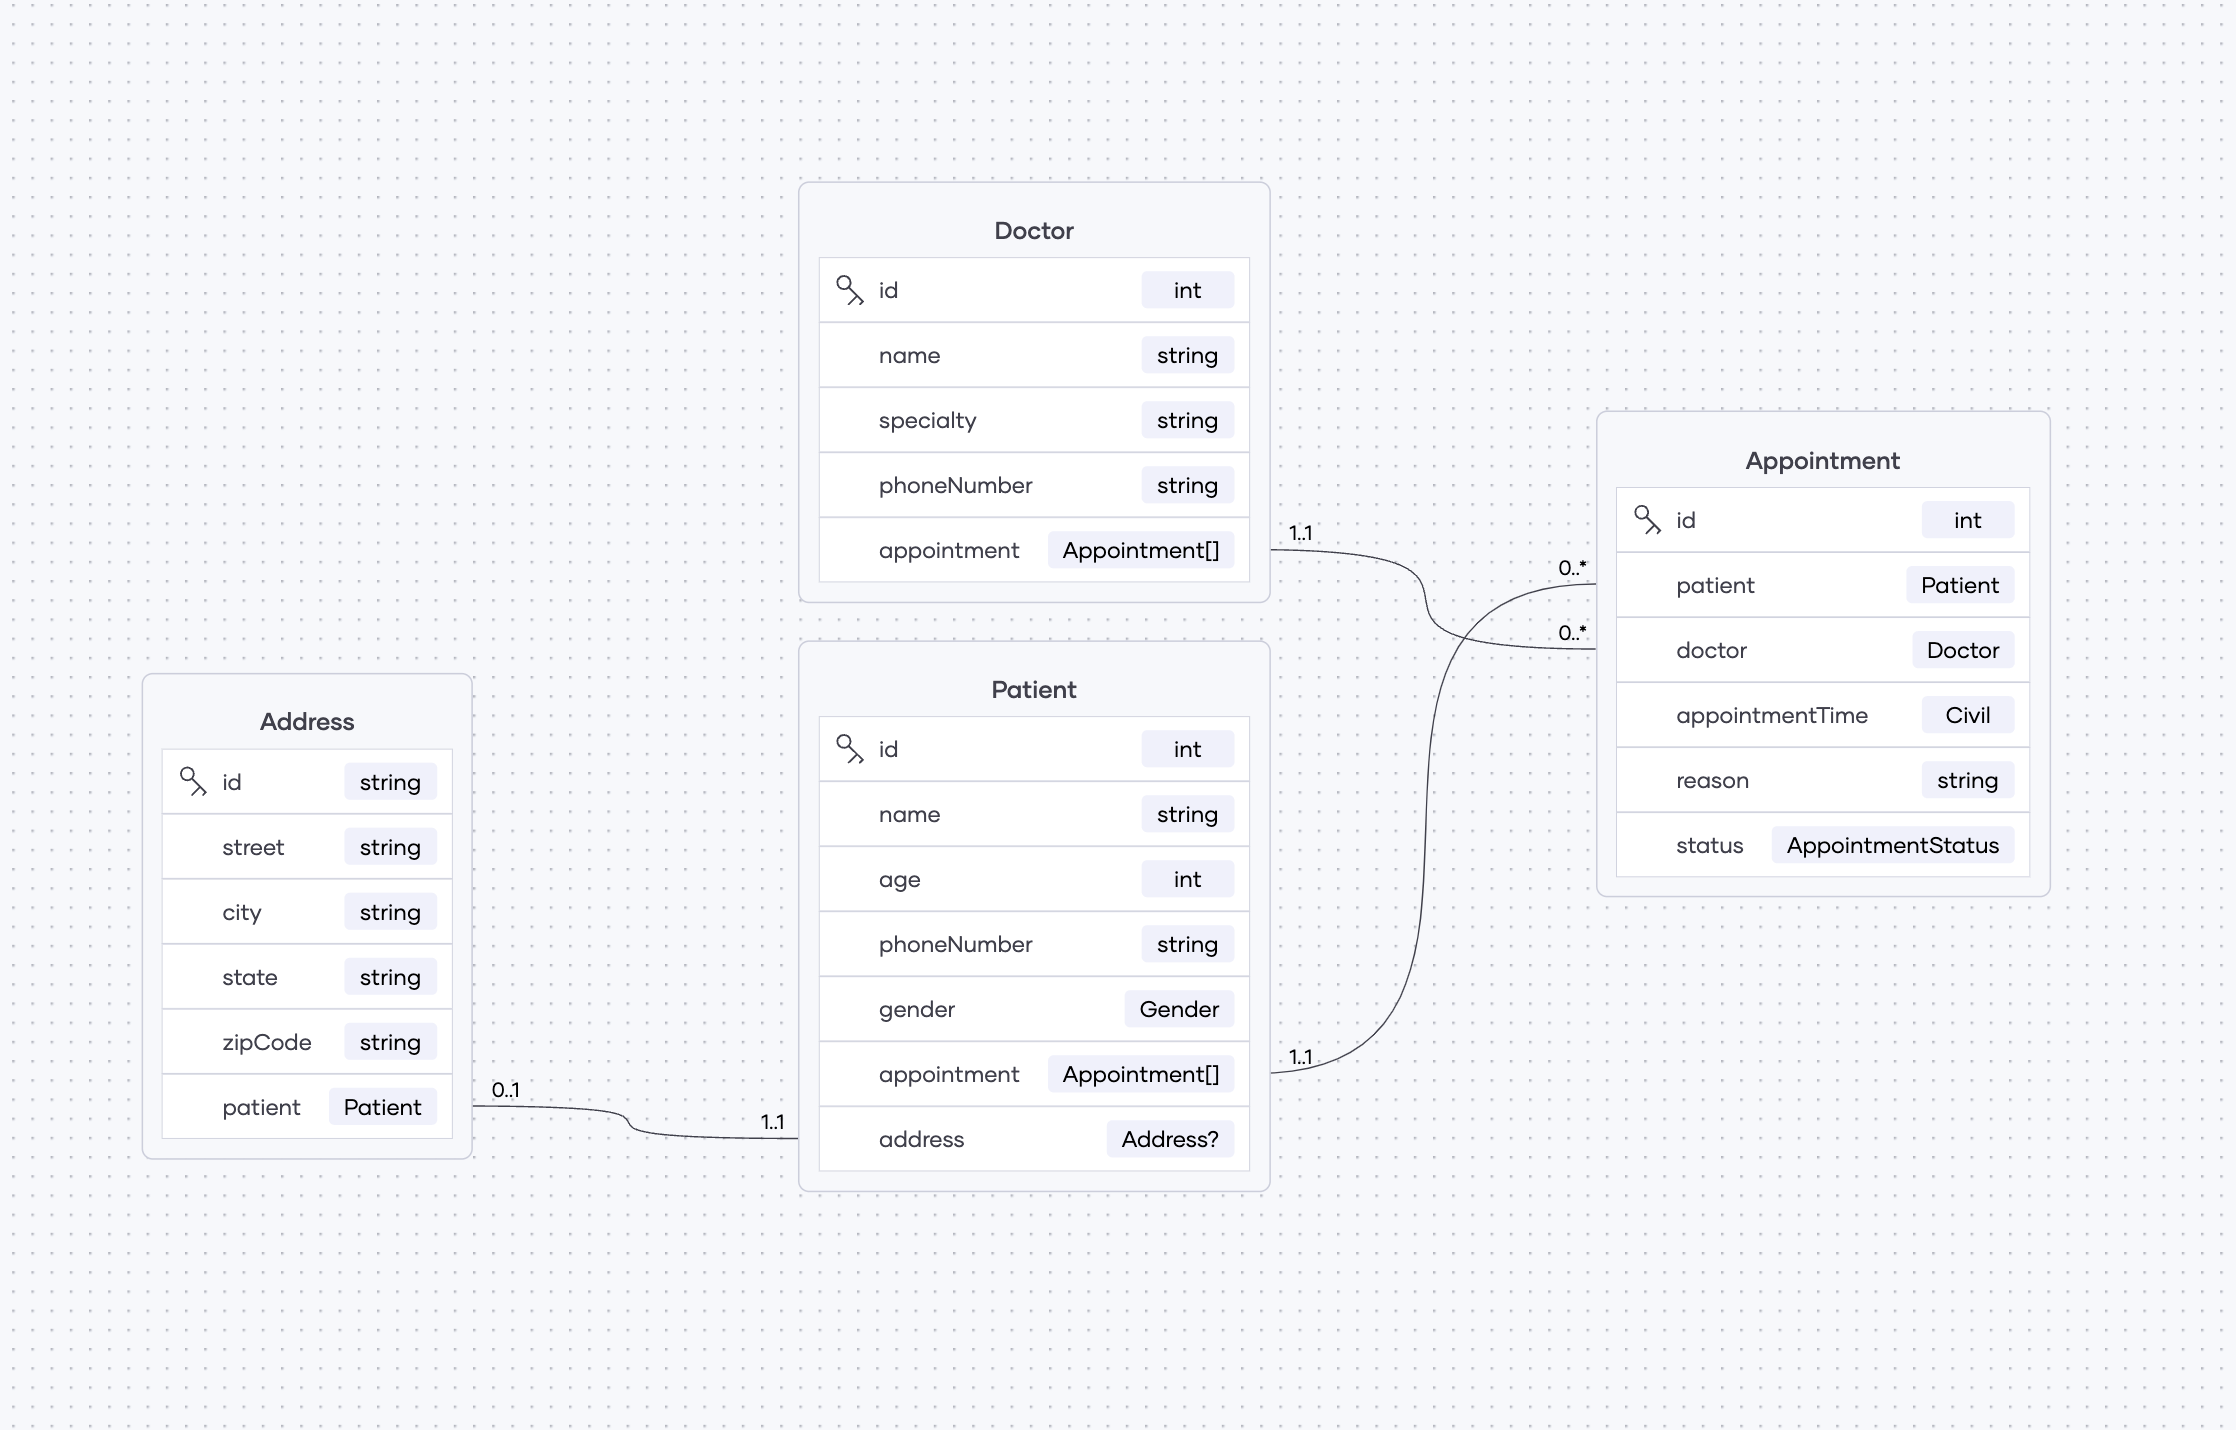
For example, a bal persist data model definition can be represented graphically as shown below.
Data model definition
Below is a sample data model definition.
import ballerina/time; import ballerina/persist as _; type Patient record {| readonly int id; string name; int age; string phoneNumber; Gender gender; Appointment[] appointment; Address? address; |}; type Doctor record {| readonly int id; string name; string specialty; string phoneNumber; Appointment[] appointment; |}; type Appointment record {| readonly int id; Patient patient; Doctor doctor; time:Civil appointmentTime; string reason; AppointmentStatus status; |}; type Address record {| readonly string id; string street; string city; string state; string zipCode; Patient patient; |}; enum AppointmentStatus { SCHEDULED, CANCELLED, STARTED, ENDED }; enum Gender { MALE, FEMALE };
Graphical view
Below is the graphical representation or the Entity Diagram View of the above sample data model.