Back to VS Code home
The VS Code extension provides the three types of sessions below to debug your Ballerina code.
- Program debug sessions - debug a Ballerina program
- Test debug sessions - debug a test function
- Remote debug sessions - debug a Ballerina program that is running remotely
Debug methods
There are two methods to debug the above sessions.
-
Click on the Debug CodeLens, which appears at the top of a Ballerina program or a test function.
-
Create a
launch.jsonfile with the required configuration attributes (use the default configurations or edit them as required) and use either of the options below.- Ballerina Debug
- Ballerina Test
- Ballerina Remote
Debug using CodeLens
The Ballerina extension provides multiple options to debug Ballerina applications and the most convenient way is to use the context-aware debug CodeLens support.
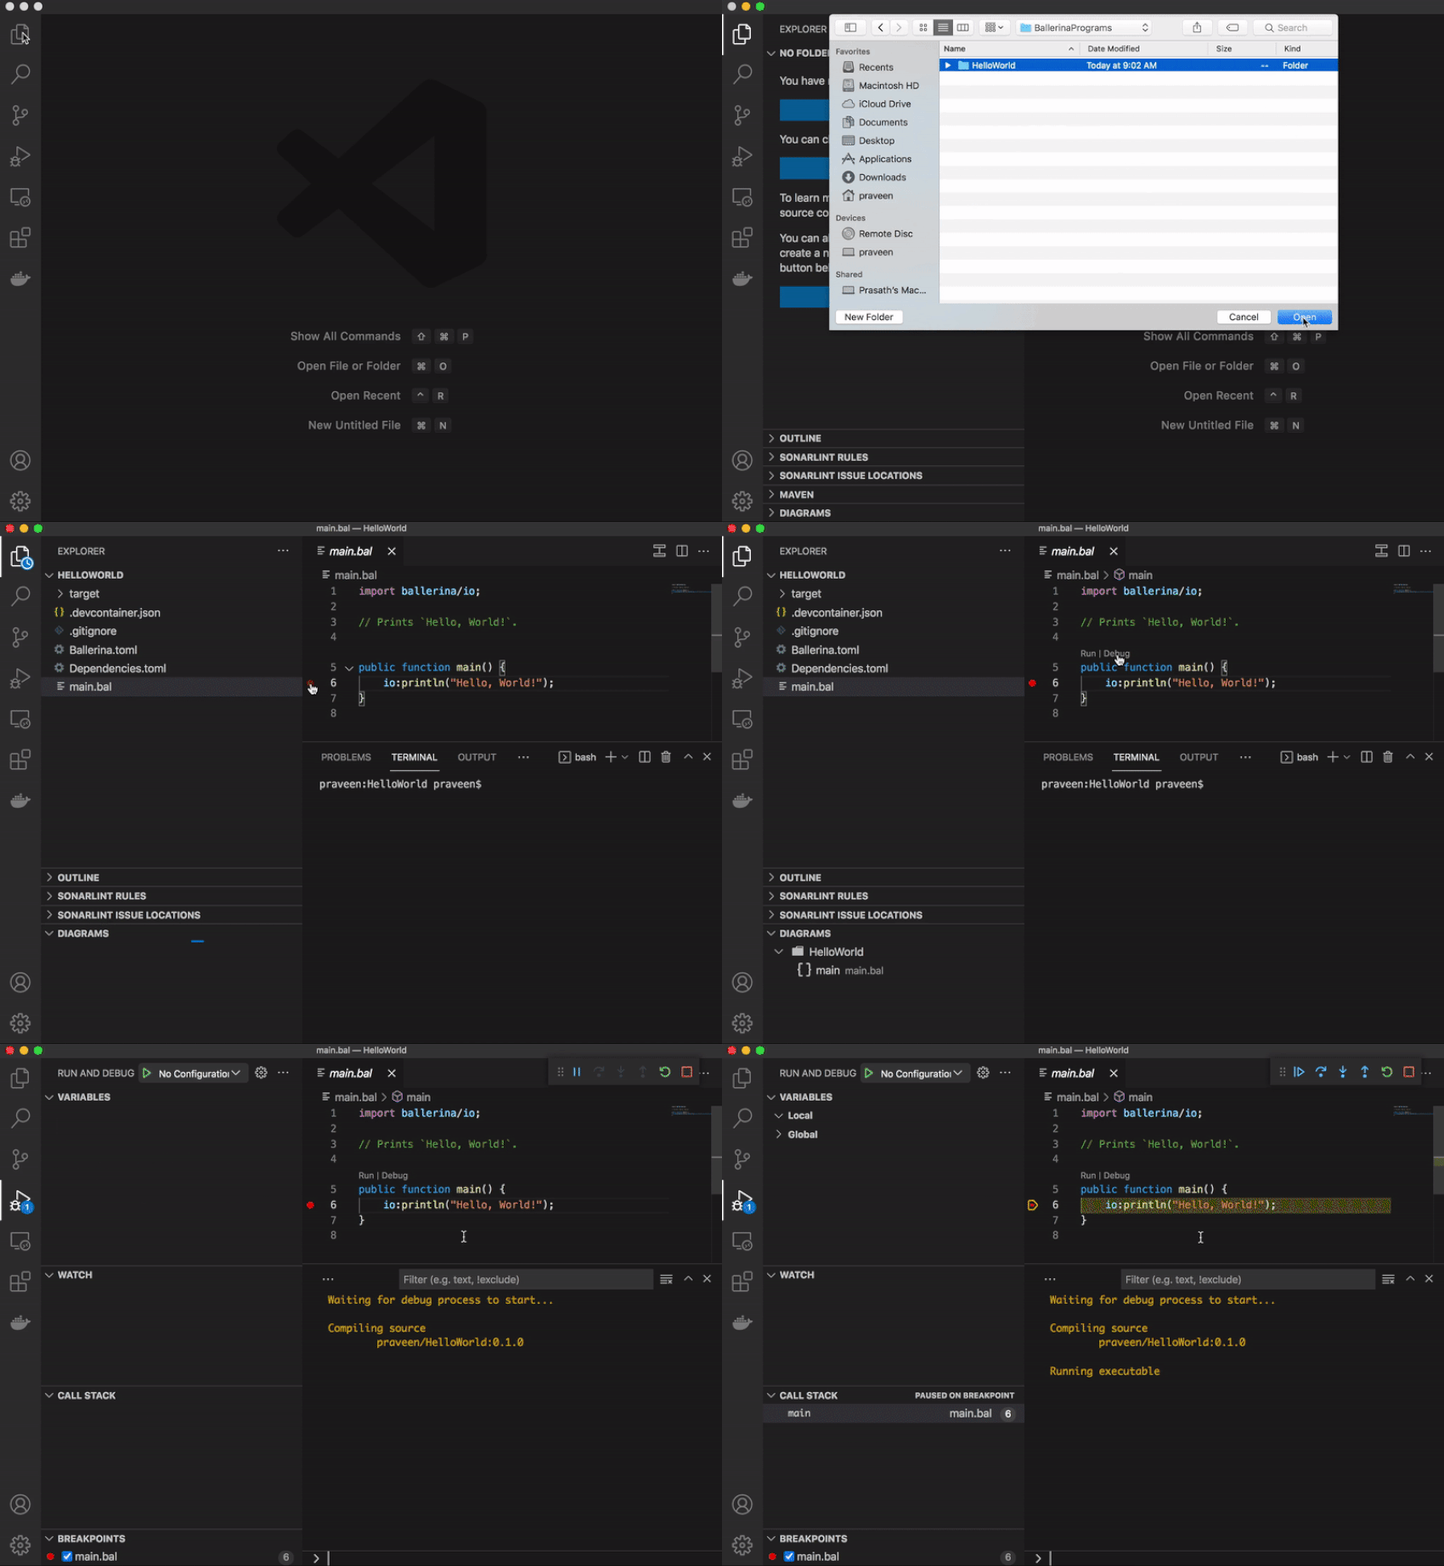
You can use the CodeLens for program and test debug sessions as shown in the sections below.
Info: Use the
launch.jsonconfigurations to launch debug sessions with additional configurations (i.e., program arguments, environment variables), or to start a remote debug session. For more information, see Debug using configurations.
Program debug sessions
Follow the steps below to start a quick debug session using the CodeLens.
-
Open the folder, which includes the Ballerina program you want to debug and open the source file in the editor.
-
Click in front of the line numbers of the file you want to debug to add the required debug points.
-
Click the
DebugCodeLens, which will appear just above themain()method.

Test debug sessions
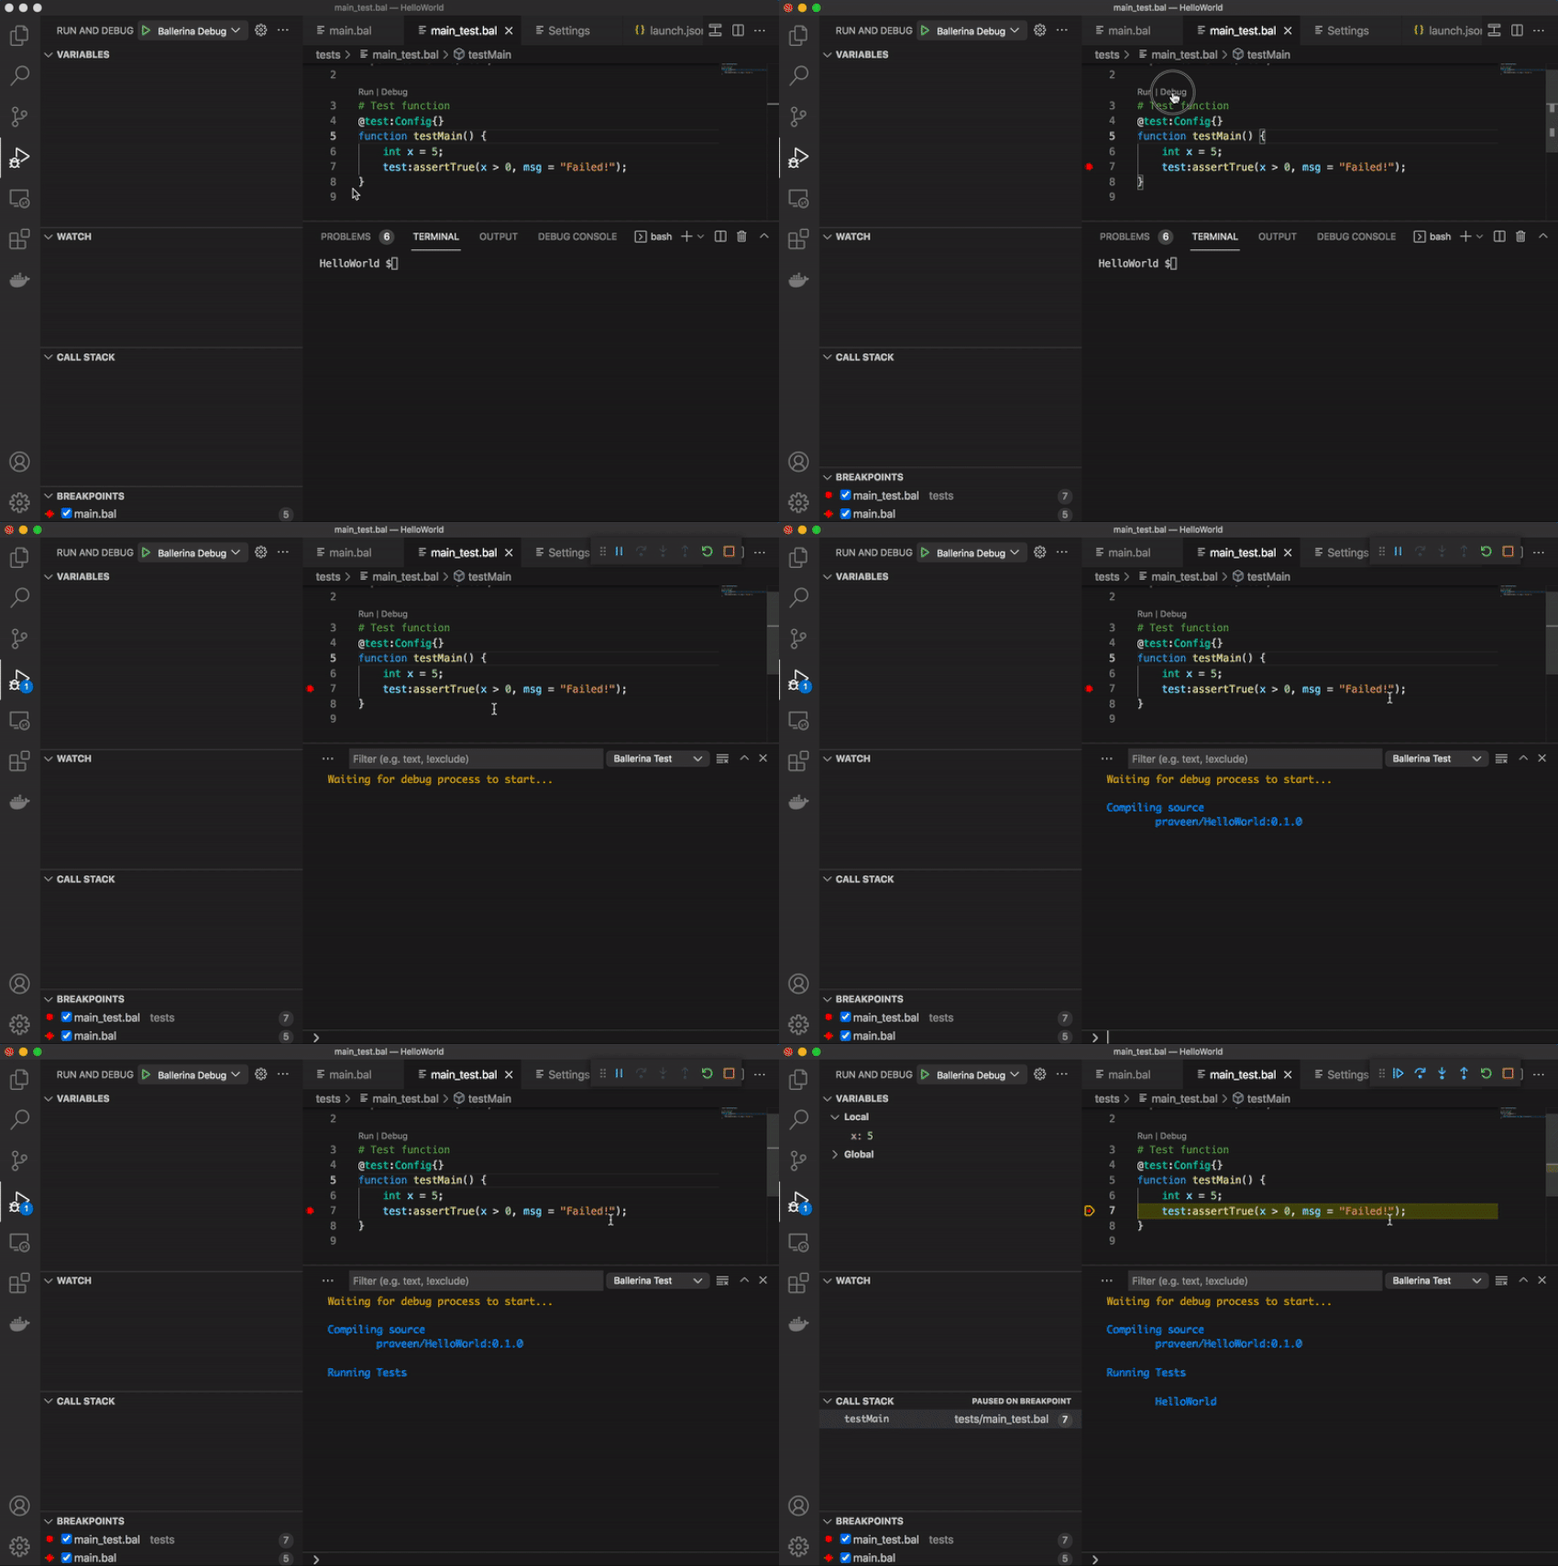
You can use the CodeLens to debug Ballerina test functions as well. The debug CodeLens will automatically appear on top of each Ballerina test function. Click on the corresponding CodeLens as shown below to execute/debug only the selected test case.

Debug using configurations
Follow the steps below to start a debug session with configurations. All the configurations need to be added in the launch.json file.
Info: If you launch the debug session through VS Code, the working directory will be the Ballerina package root. However, you can use remote debugging for alternative working directories.
-
Create the
launch.jsonfile. For instructions, see Create the configuration file.Info: This enables the Ballerina Program, Ballerina Test, and Ballerina Remote options that are required to debug your code using configurations.
-
Click in front of the line numbers of the file you want to debug to add the required debug points.
-
Start a program, test, or remote debug session as shown below.
Program debug sessions
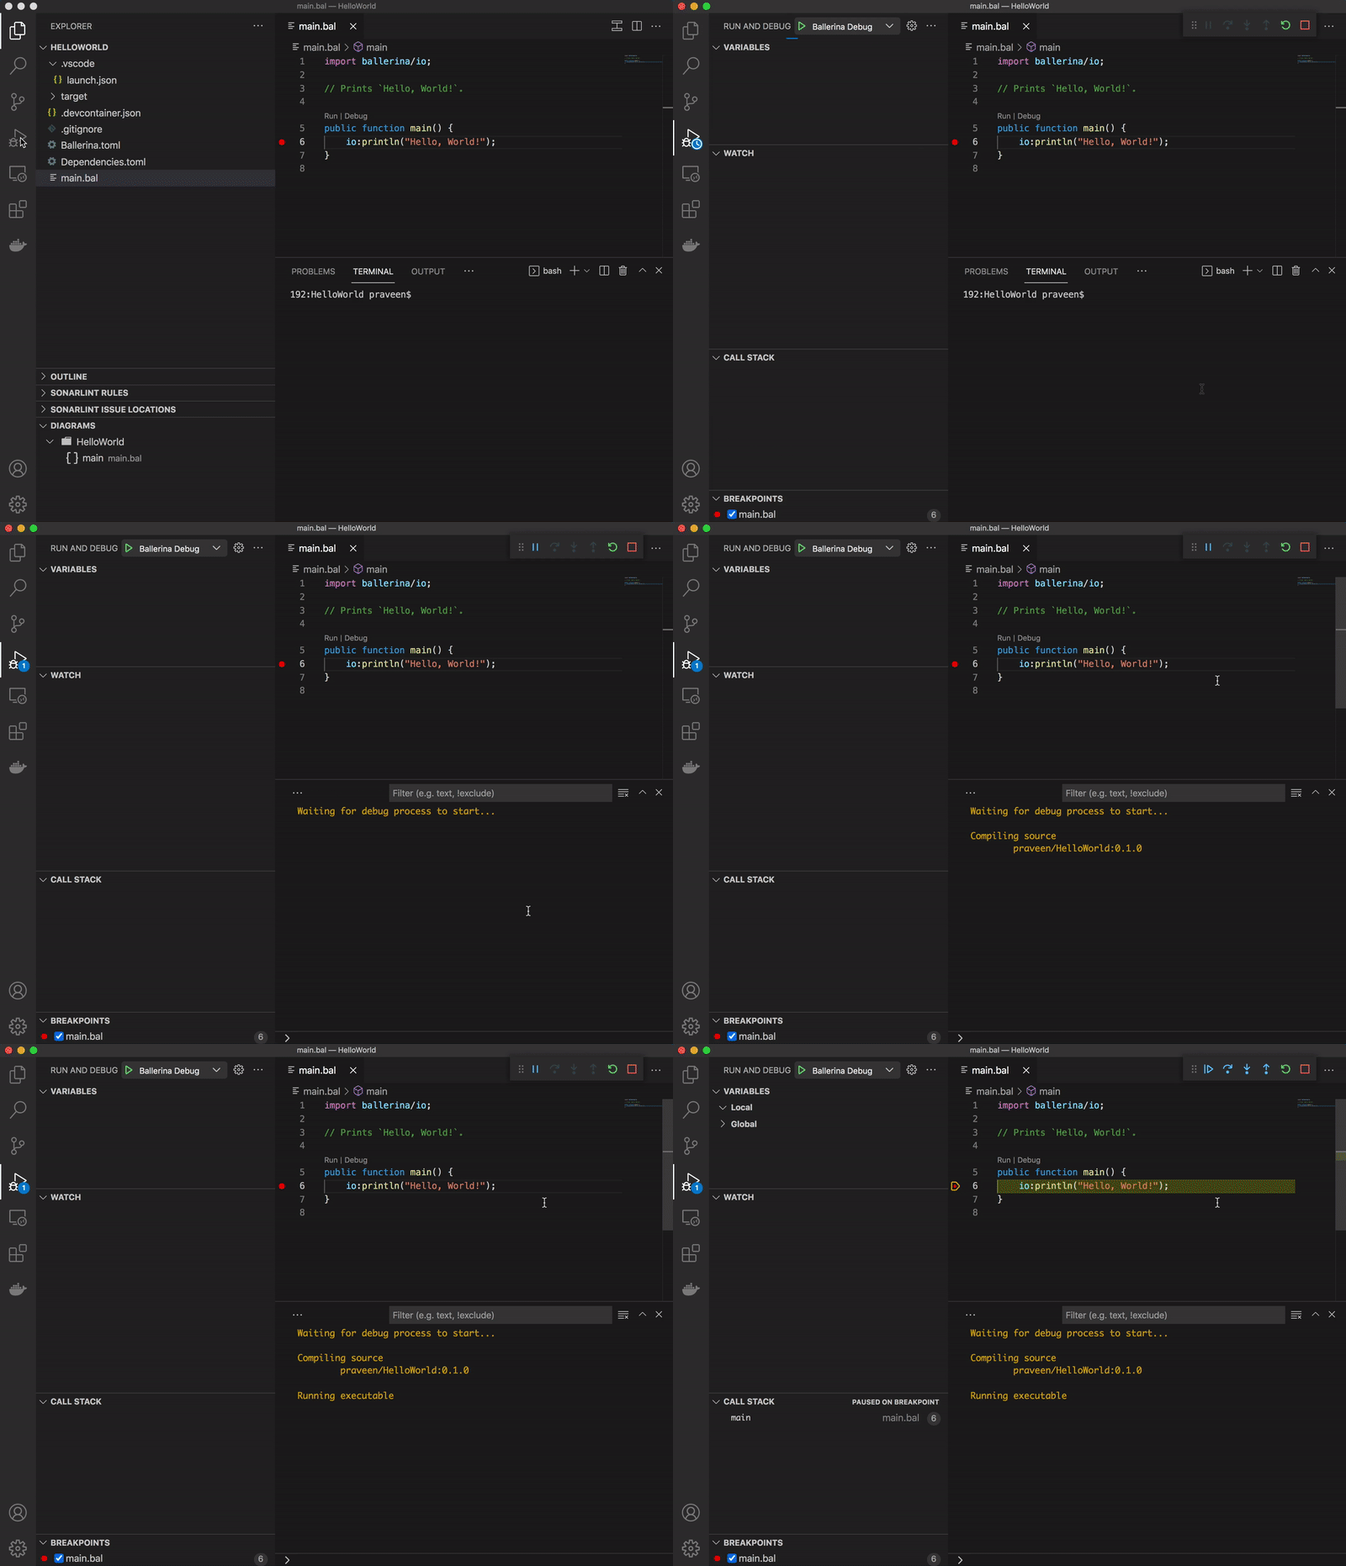
Follow the steps below to start a program debug session.
-
Select Ballerina Debug from the drop-down menu available in the upper left corner to start a program debug session.
-
Click the Start Debugging icon on the upper left corner to start debugging.
You will see the output in the DEBUG CONSOLE.

Test debug sessions
Follow the steps below to start a test debug session.
-
Select Ballerina Test from the drop-down menu available in the upper-left corner to start a test debug session.
-
Click the Start Debugging icon in the upper-left corner to start debugging.
You will see the output in the DEBUG CONSOLE as shown below.

Remote debug sessions
Follow the steps below to start a remote debug session.
-
Create the
launch.jsonconfiguration file if it is not created already.Info: For instructions on creating the
launch.jsonfile, see debug configurations. -
Open the
launch.jsonfile and configure thedebuggeeHostanddebuggeePortattributes under theBallerina Remoteconfigurations section accordingly. -
After setting the remote debug configurations, select Ballerina Remote from the drop-down available in the upper left corner to start a remote debug session.
-
Open a terminal and execute the debug command that is relevant to your requirement from the ones below.
Command Description bal run --debug <DEBUGGEE_PORT> <BAL_FILE_PATH/PACKAGE_PATH>Debug a Ballerina package or a single file bal run --debug <DEBUGGEE_PORT> <EXECUTABLE_JAR_FILE_PATH>Debug a Ballerina executable JAR bal test --debug <DEBUGGEE_PORT> <PACKAGE_PATH>Debug Ballerina tests The terminal will show the following log.
Listening for transport dt_socket at address: 5005 -
Click the Start Debugging icon on the upper-left corner to start debugging.
You will see the output in the DEBUG CONSOLE as shown below.

Info: For detailed information on the feature-rich debugging experience for troubleshooting Ballerina applications provided via the Ballerina VS Code extension, see Debug features.