Back to VS Code home
The Ballerina VS Code extension currently supports the debug features below.
- Breakpoints
- Pause & continue
- Expression evaluation
- Strand and Stacktrace view
- Variable view
- Launch/Attach
- Step in/out/over
Info: The key features of the above list are described below. For information on the other VS Code debugging features, go to the VS Code documentation.
Breakpoints
The VS Code extension provides the ability to add two types of breakpoints when debugging Ballerina code.
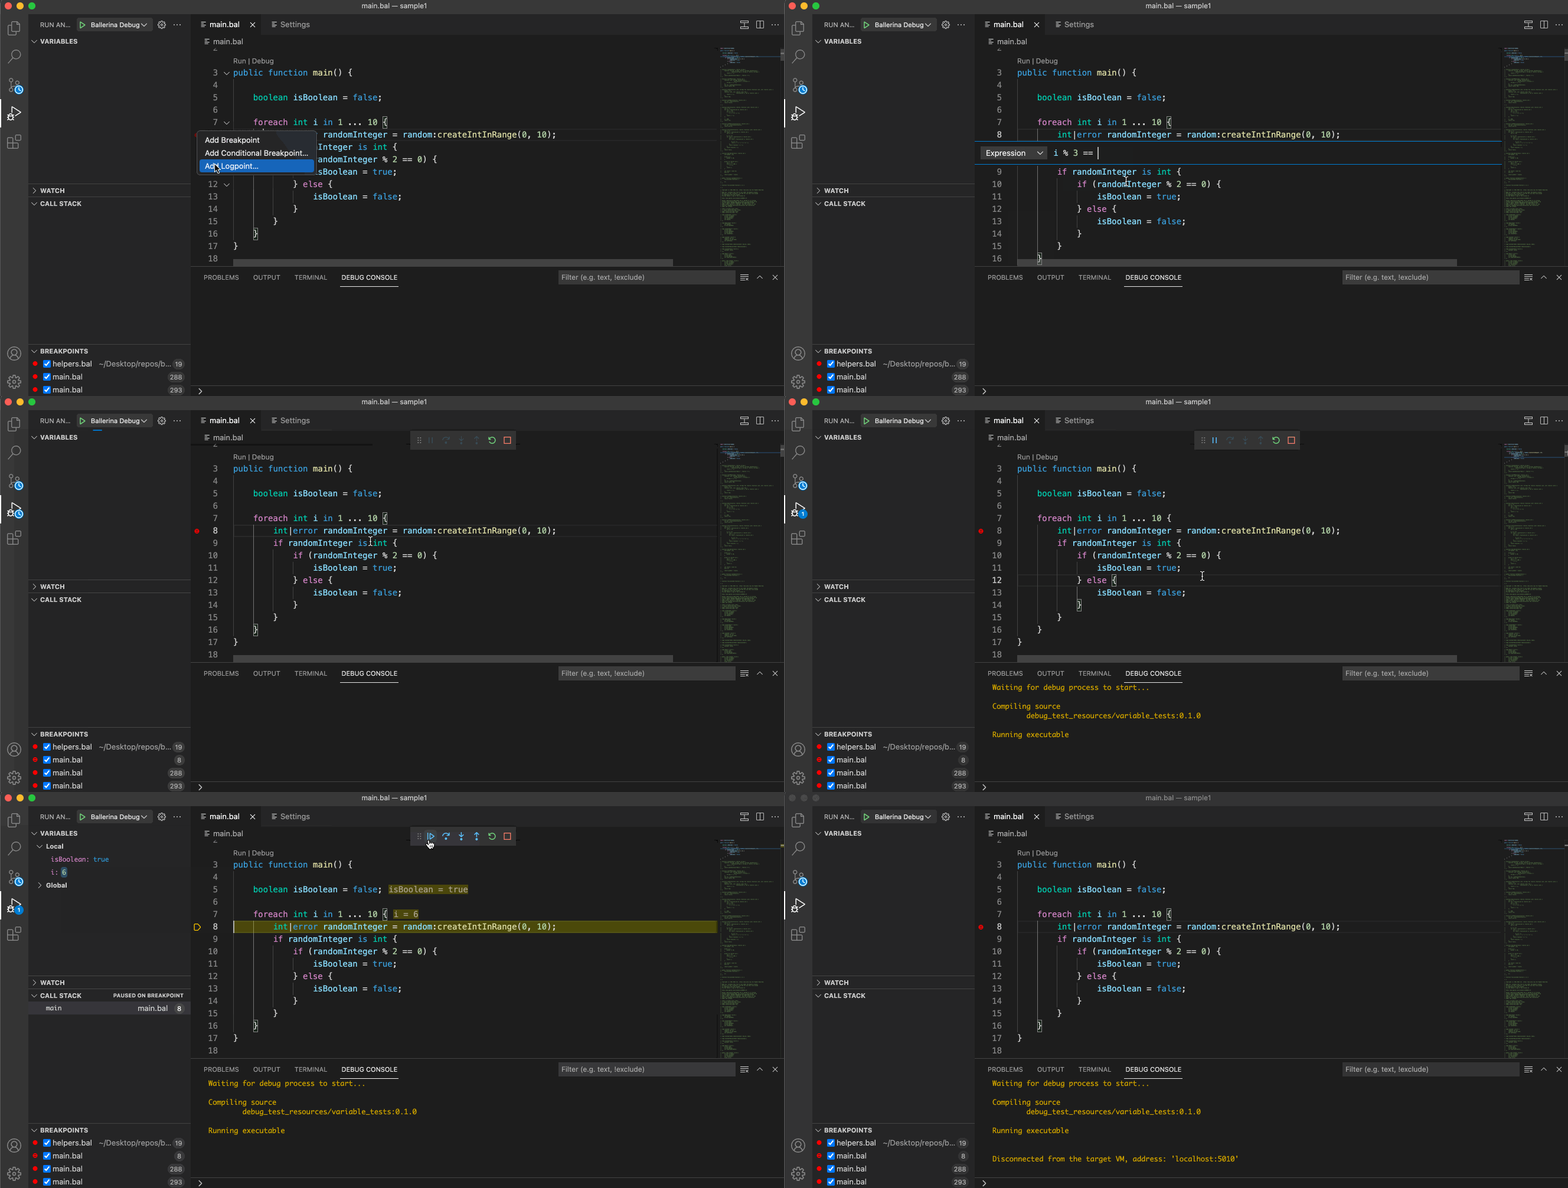
Conditional breakpoints
The Ballerina debugger provides the ability to set Ballerina expression-based conditions for regular breakpoints. The debugger will suspend at the breakpoint whenever the expression evaluates to true.
Logpoints
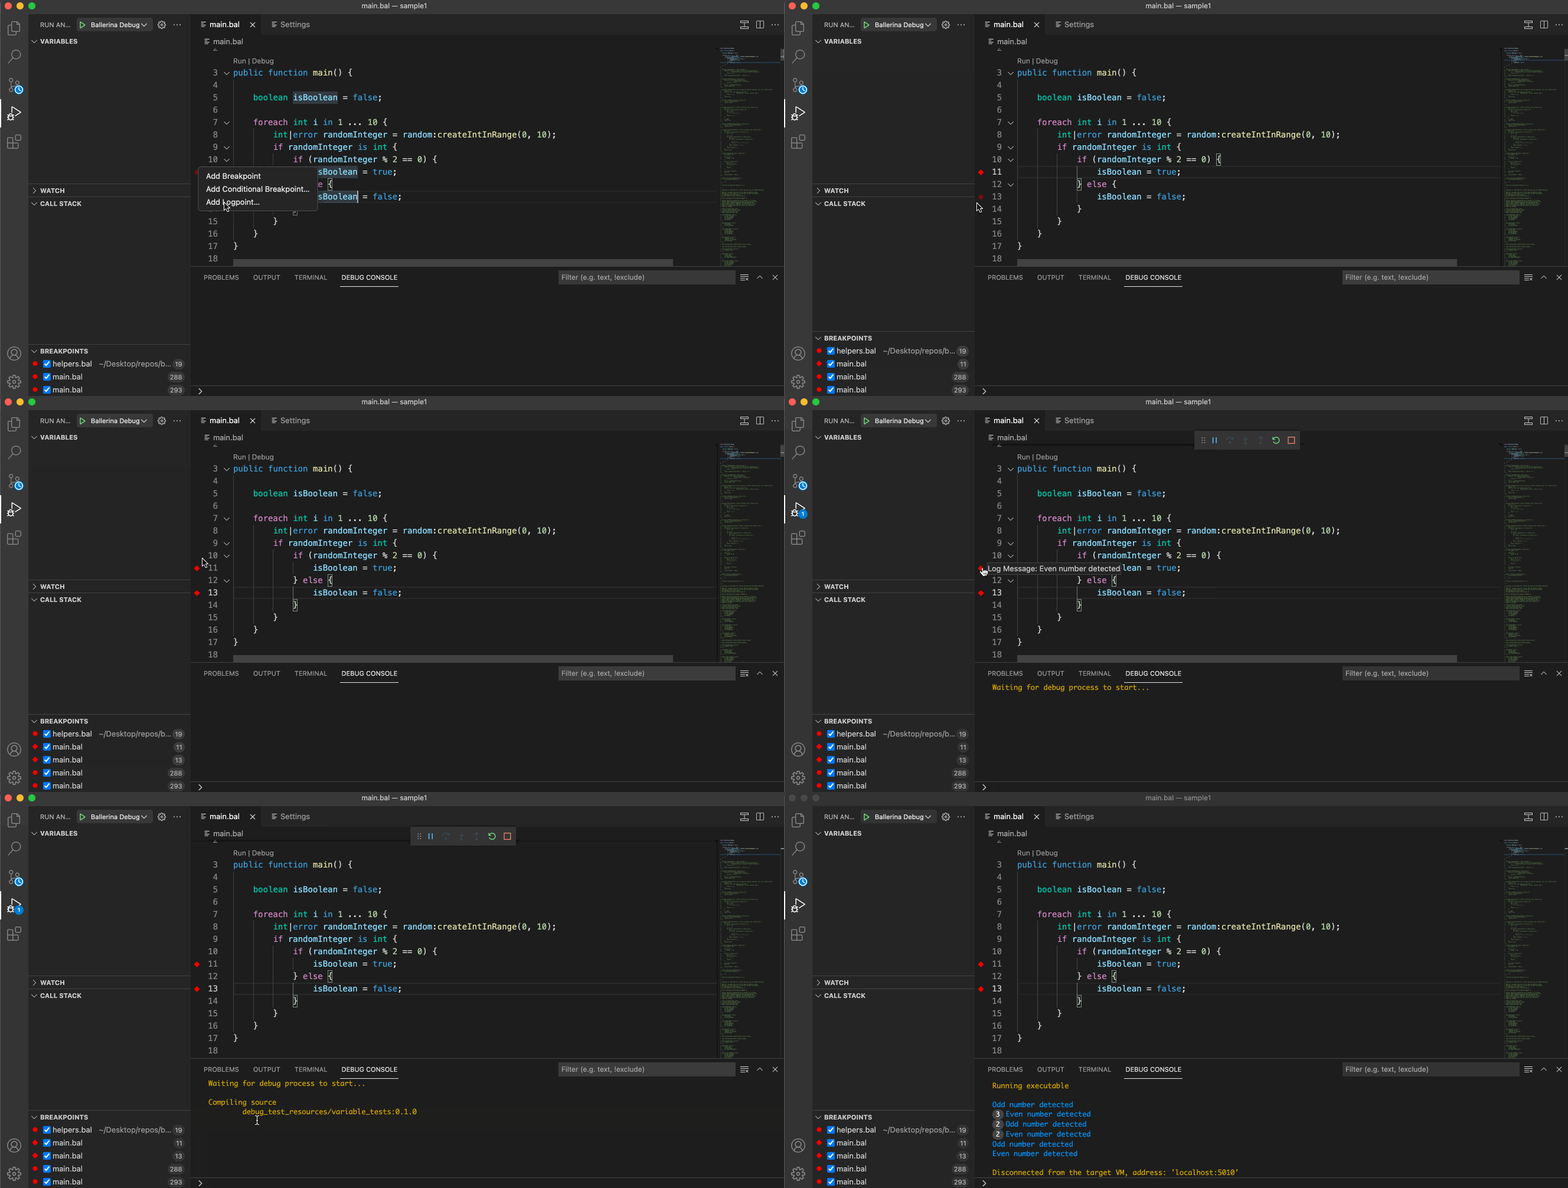
Logpoints are another variant of breakpoints, which do not break the program execution and instead, logs a message on the console. Logpoints are especially useful for injecting logging while debugging production servers that cannot be paused or stopped.
Info: Logpoints can also be enabled/disabled and can be controlled by conditions similar to regular breakpoints.
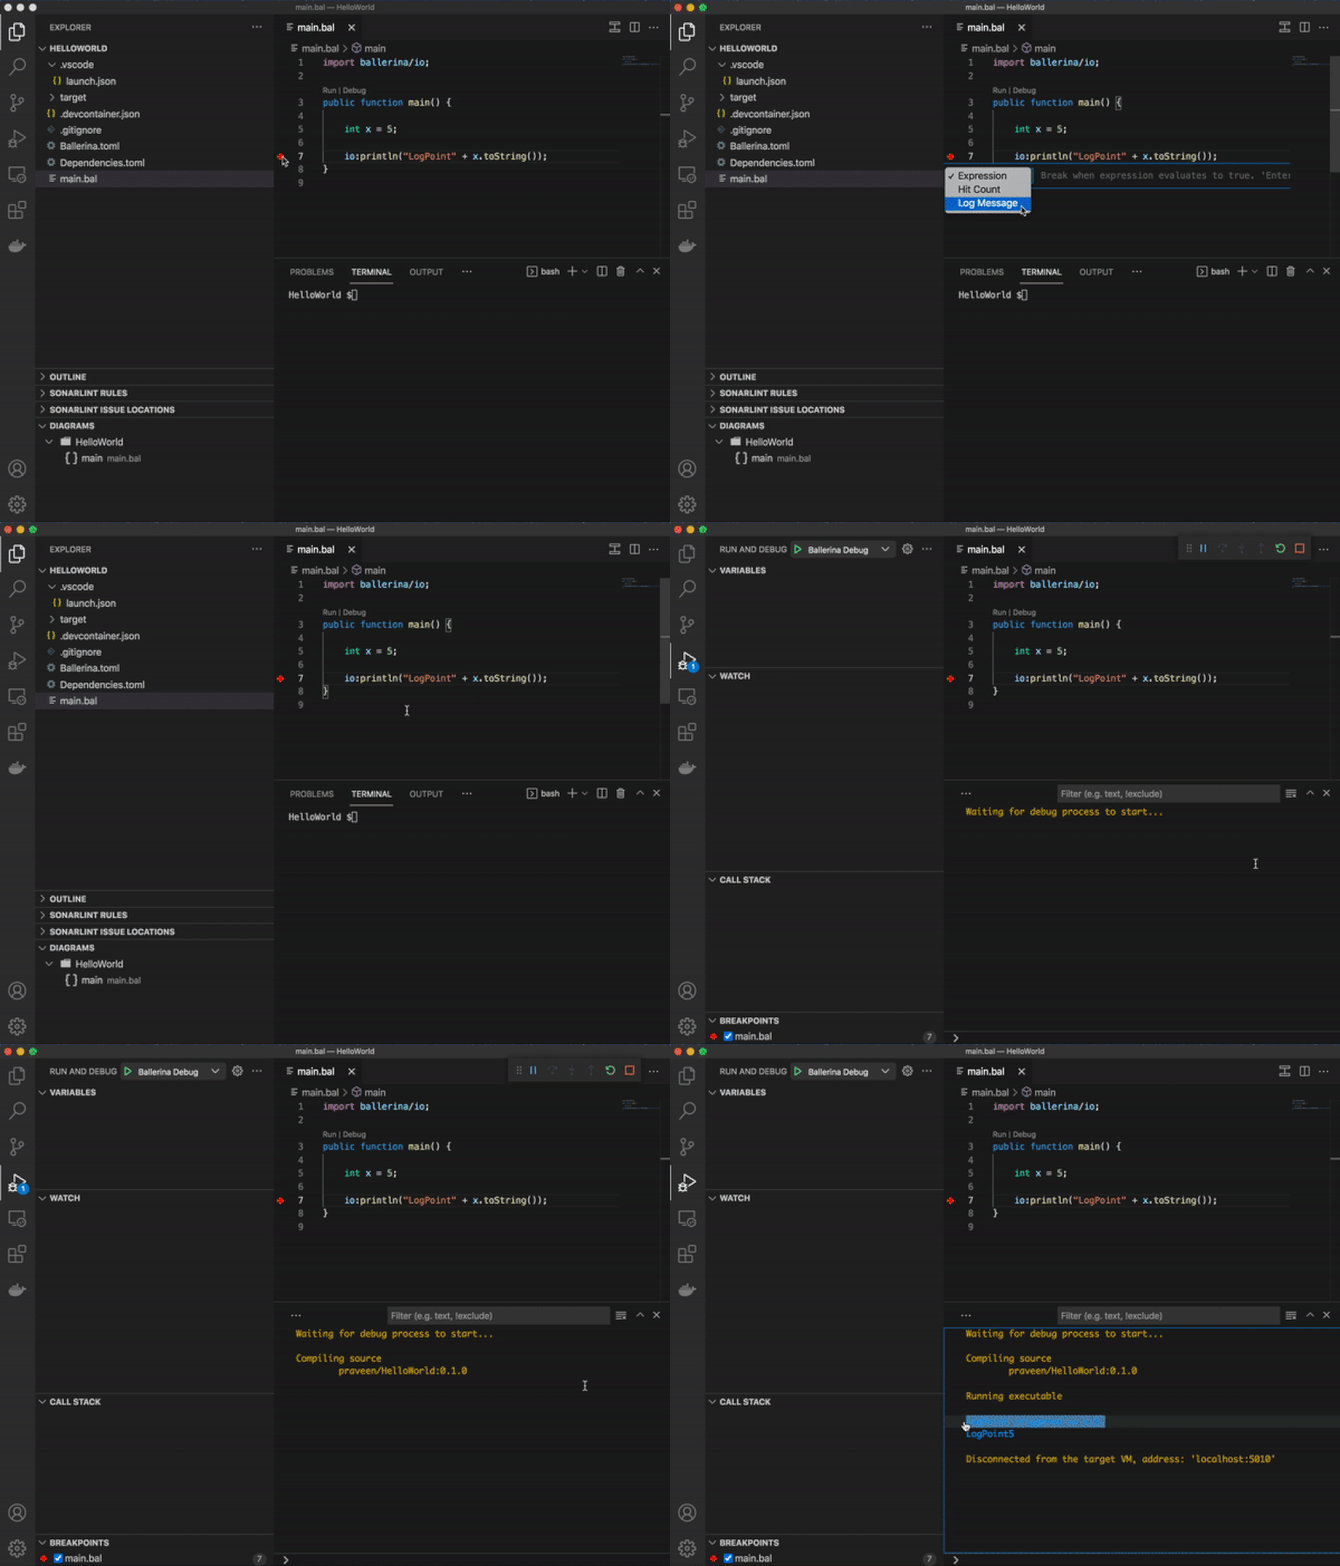
Also, log messages can either be plain texts or string templates, which can contain expressions to be evaluated within the ${} syntax.
Pause and continue
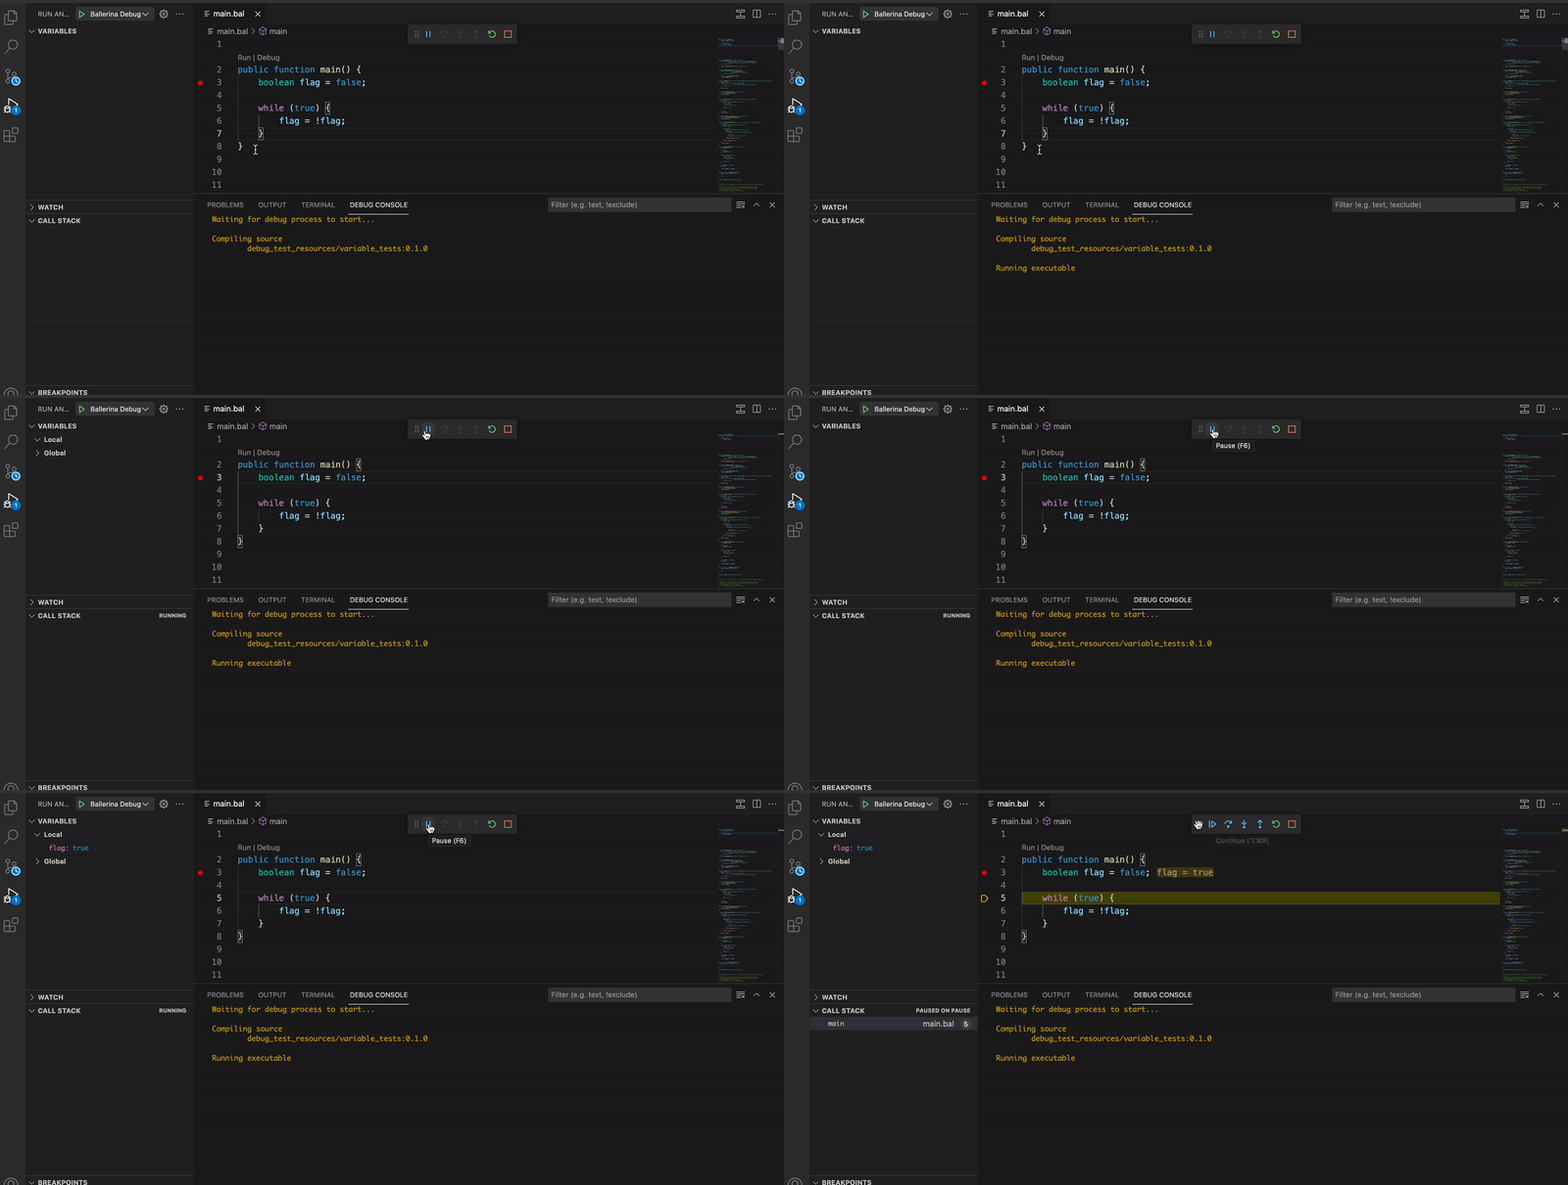
Any running Ballerina programs can be suspended immediately at the current execution line of the program using the pause command in VS Code as shown below.
With this feature, you can suspend (and resume) the remote VM resulting in a debug hit at the current execution line of the program.
Info: This feature will be useful in contexts where the program seems to be hanged due to blocking operations/infinite loops and when you want to know the exact line that the program is waiting on.
Expression evaluation
The Ballerina expression evaluator allows evaluating Ballerina variables and expressions at runtime by allowing them to be viewed when the IDE is in the break mode.
The Ballerina VSCode debugger lets you evaluate expressions in the ways below.
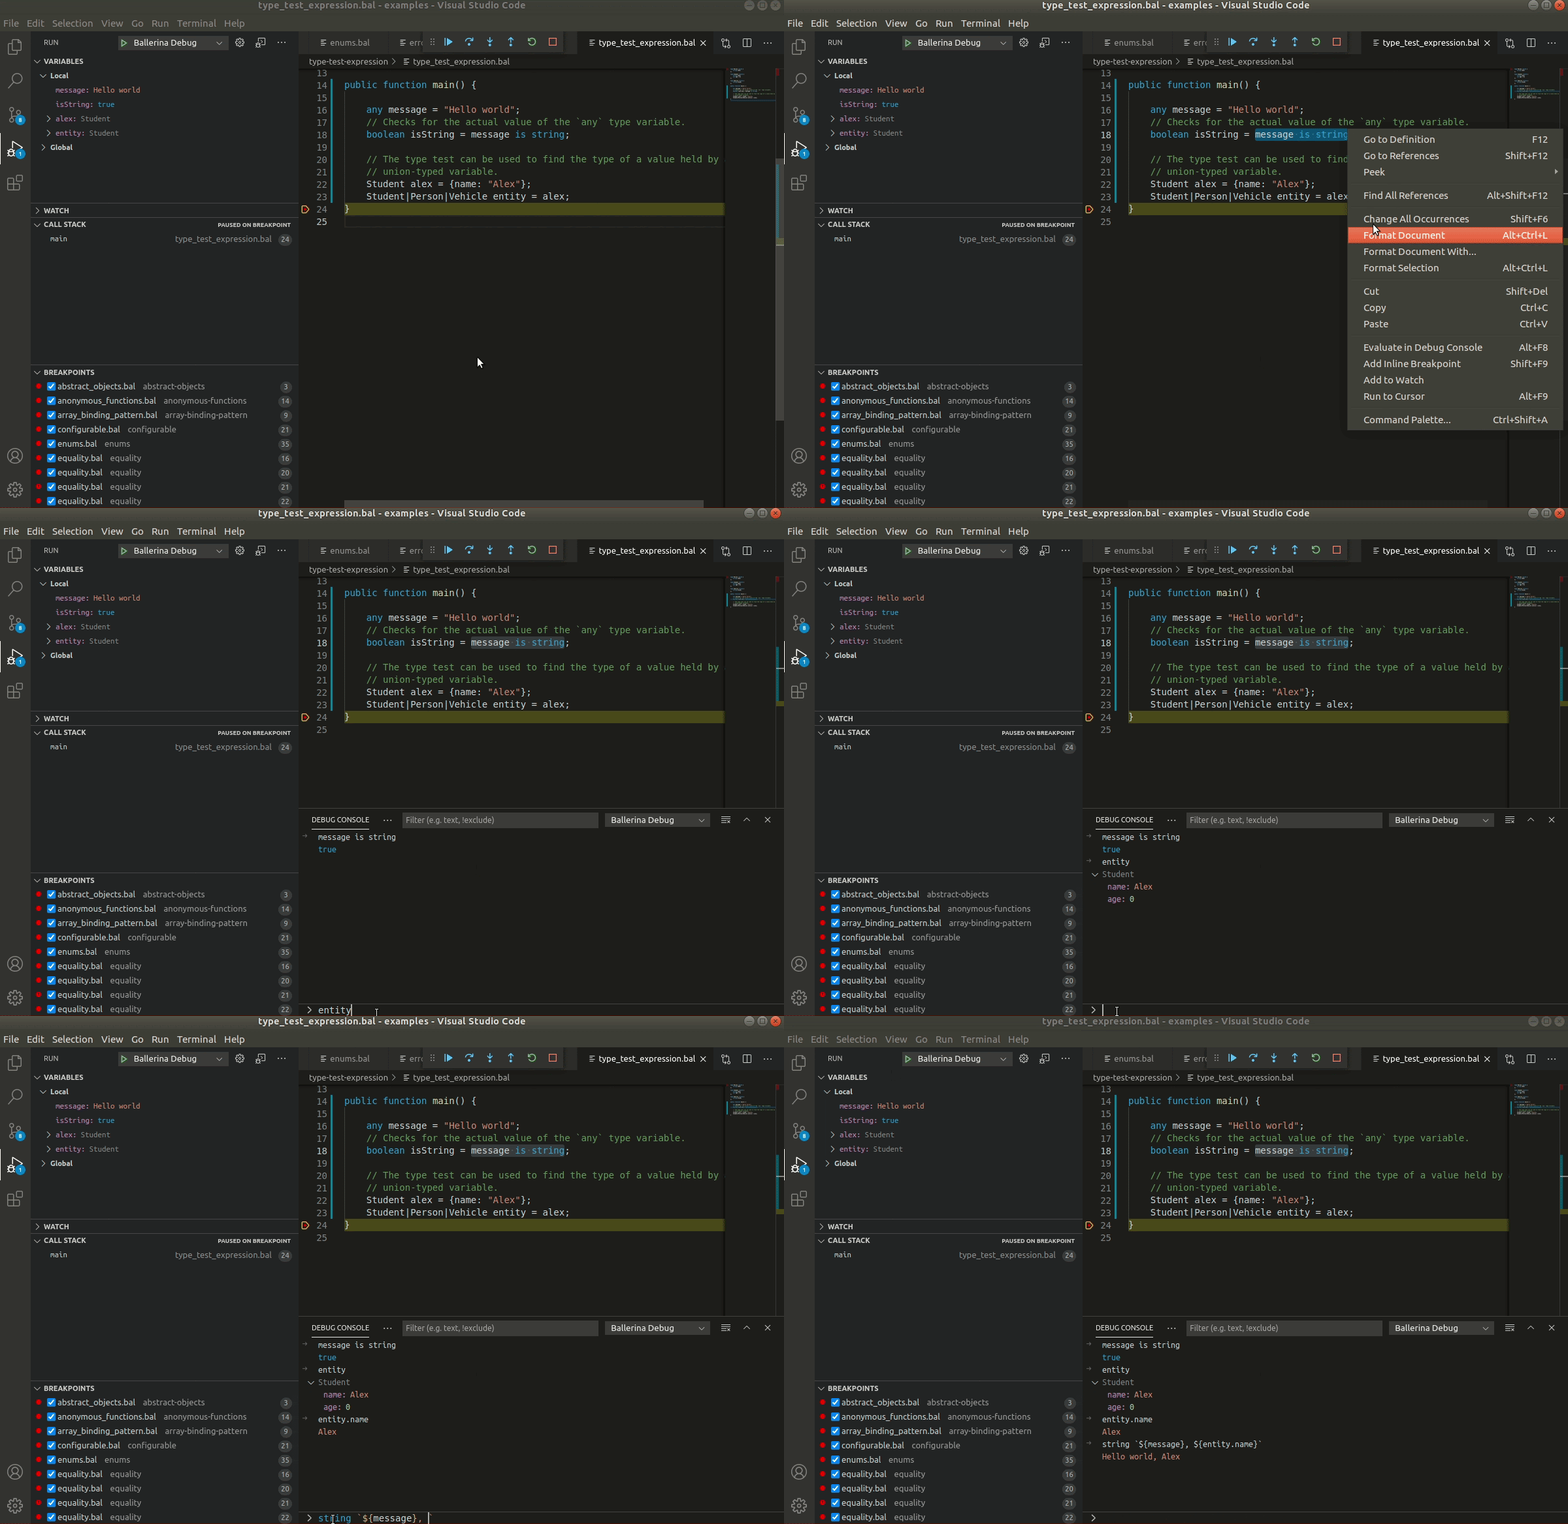
Use the debug console
You can evaluate expressions using the debug console as shown below.
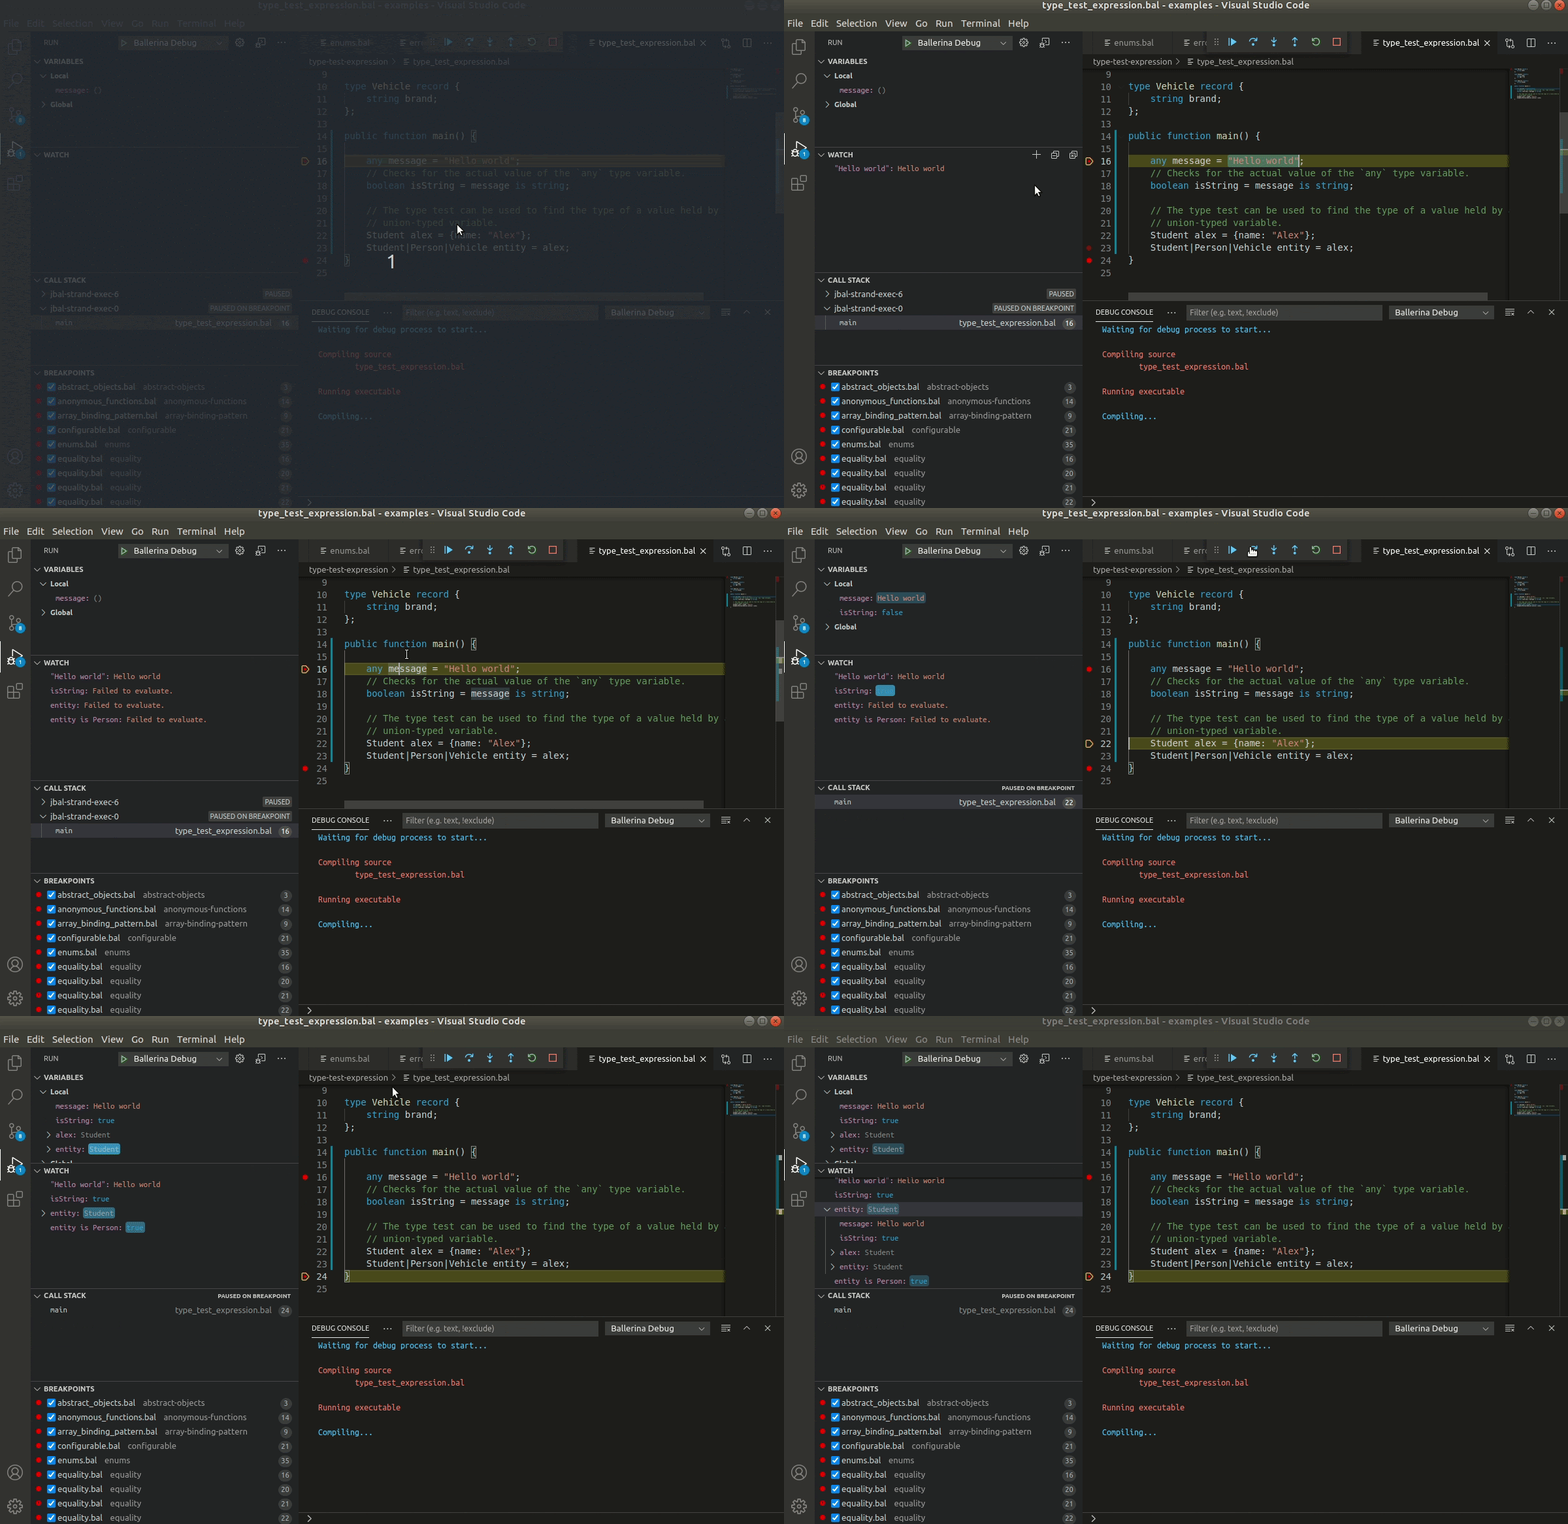
Use the watch window
You can evaluate expressions using the watch window as shown below.
Strand and stack trace view
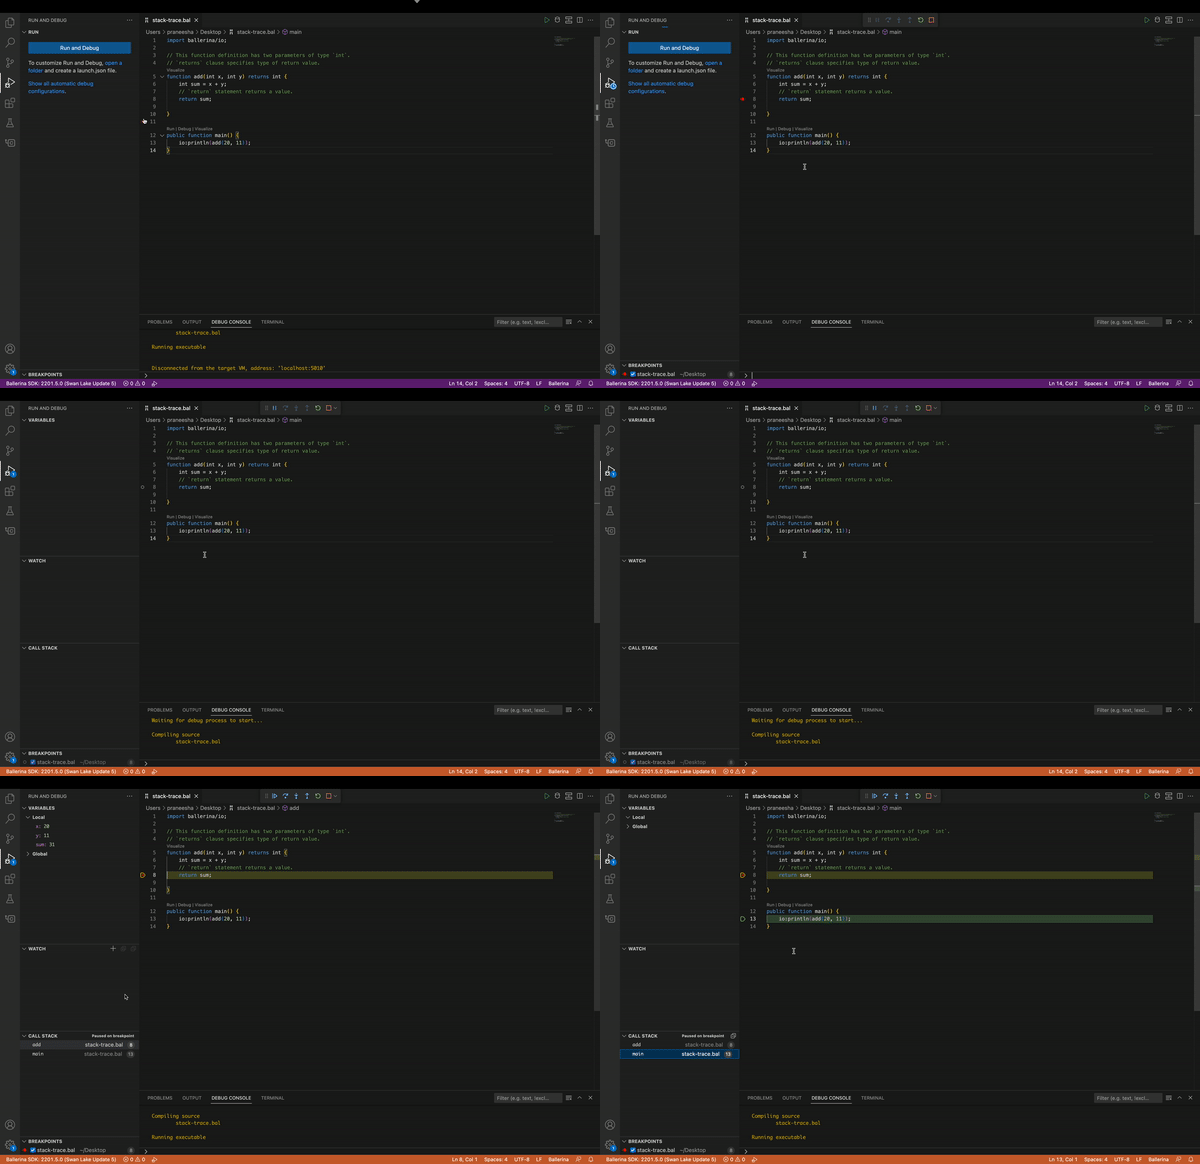
The Ballerina strand and stack trace view provides information about the call stack of the running program or the stack when the defined debug breakpoint is hit.
