Back to VS Code home
Ballerina Visualizer provides powerful ways to visually understand and build Ballerina applications. Whether you're inspecting an existing application or designing one from scratch, these tools reduce the need for deep familiarity with Ballerina syntax.
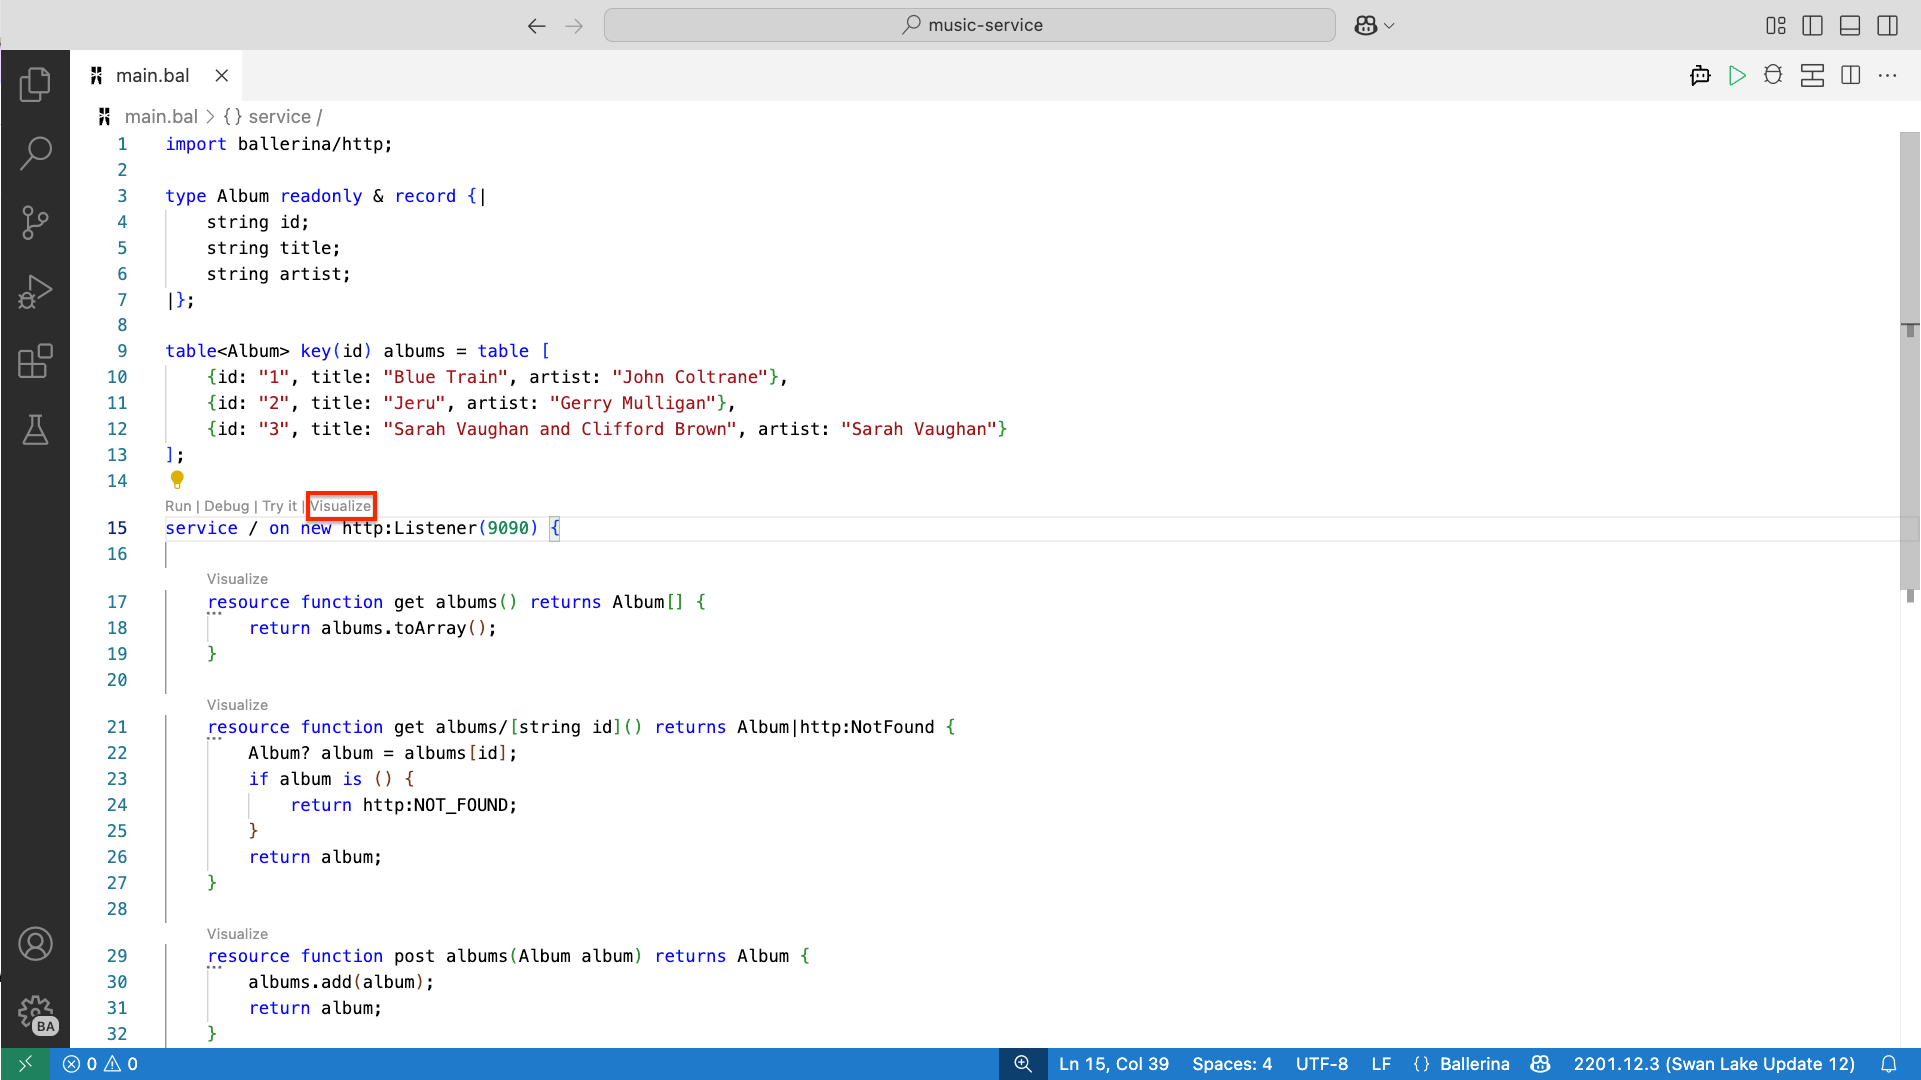
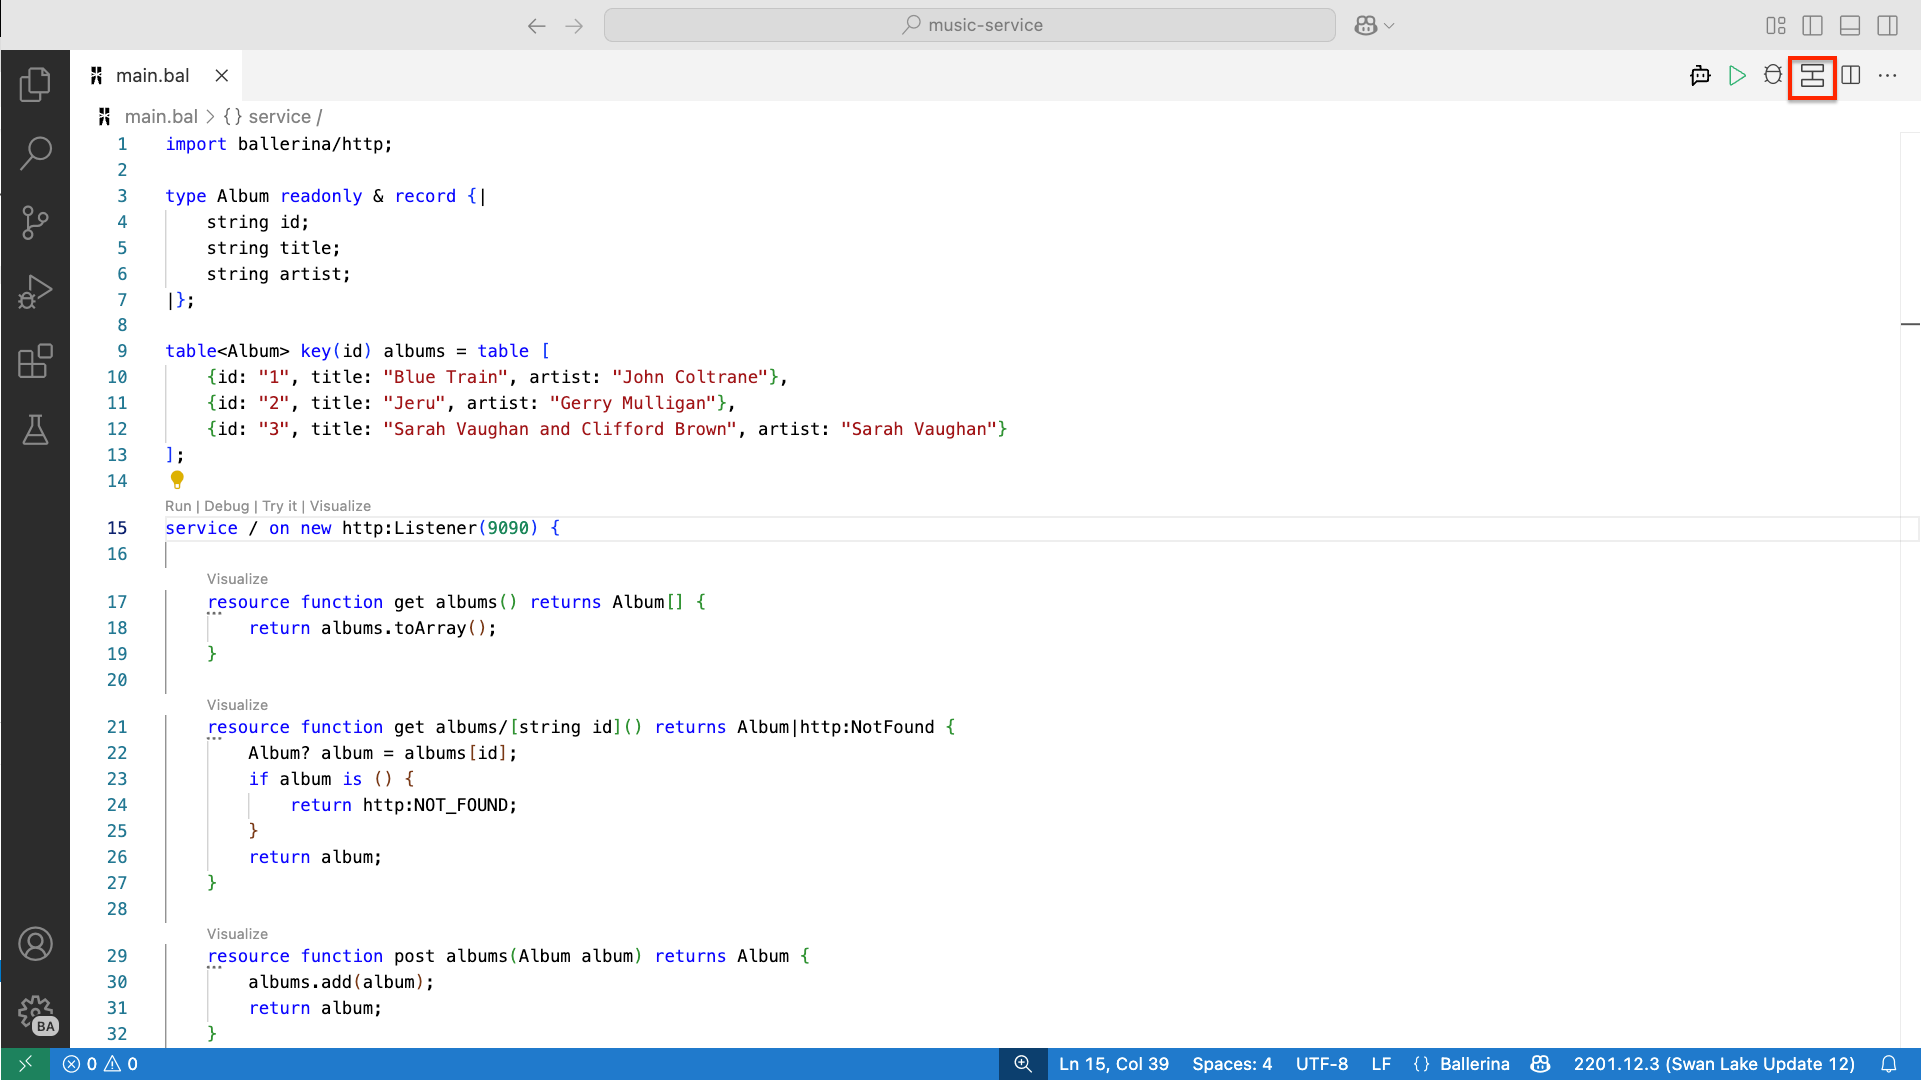
Access the Ballerina Visualizer
There are two methods for switching to the graphical mode and accessing the Ballerina Visualizer View using the VS Code extension, as shown below.
Via the CodeLens
Click the Visualize CodeLens that appears in the editor.
Via the editor group button
Click the Show Visualizer button in the editor group.
Graphical representation of code
Ballerina code can be represented graphically in the following ways.
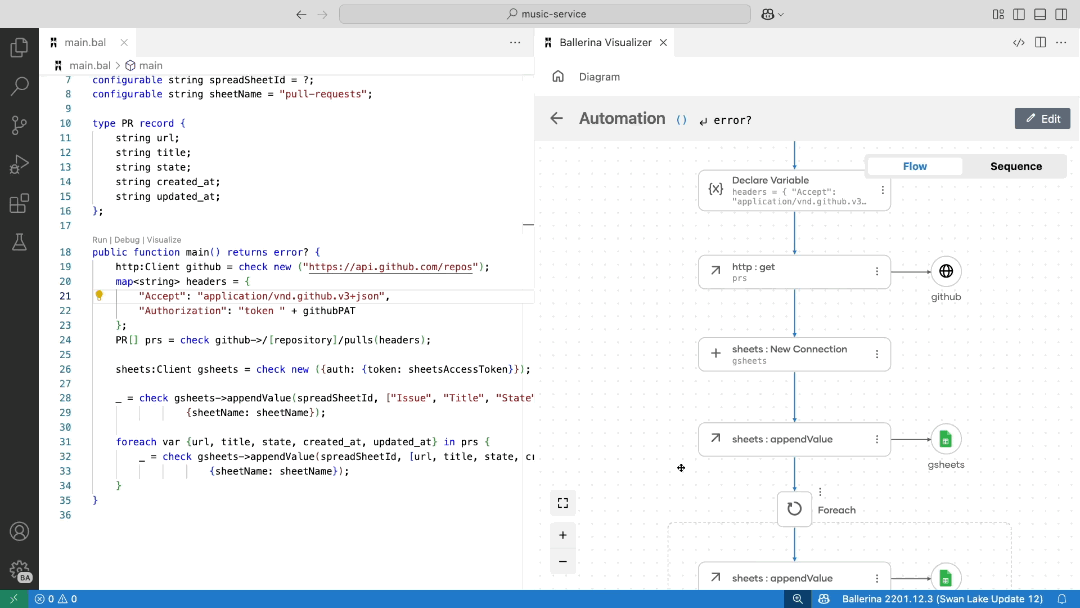
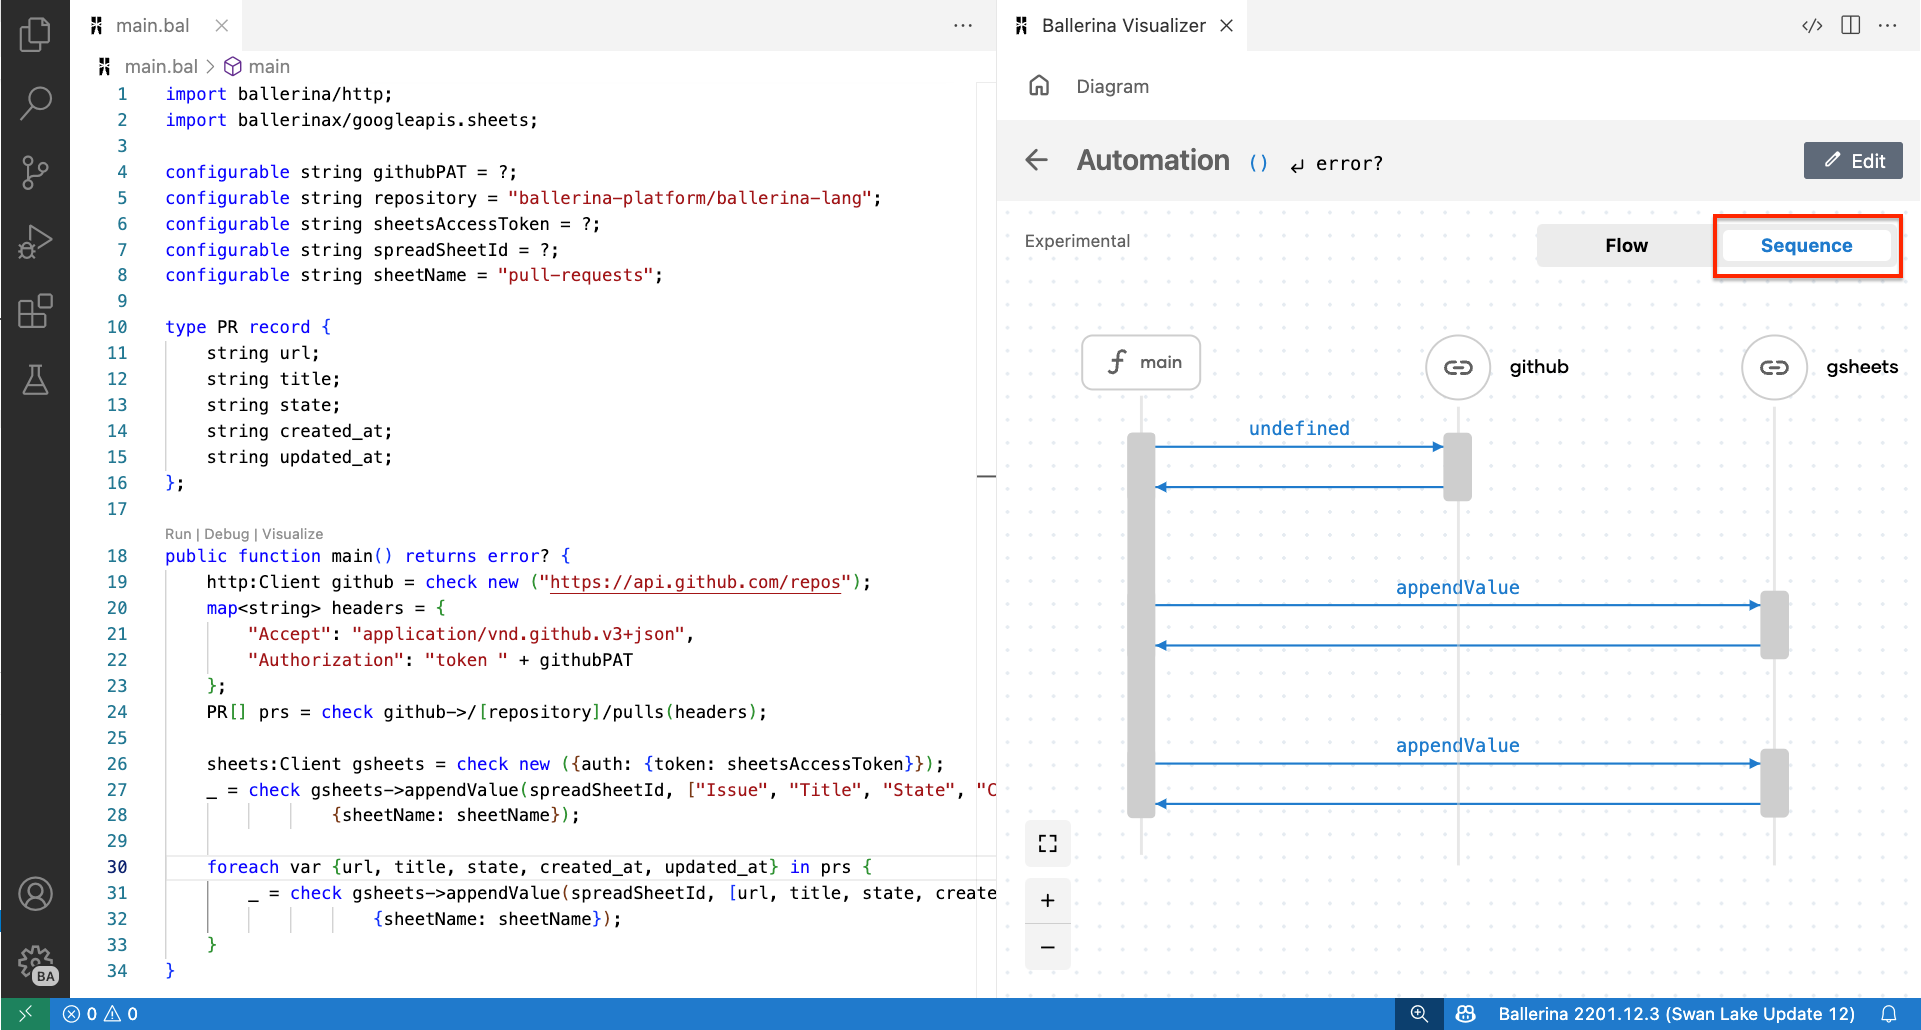
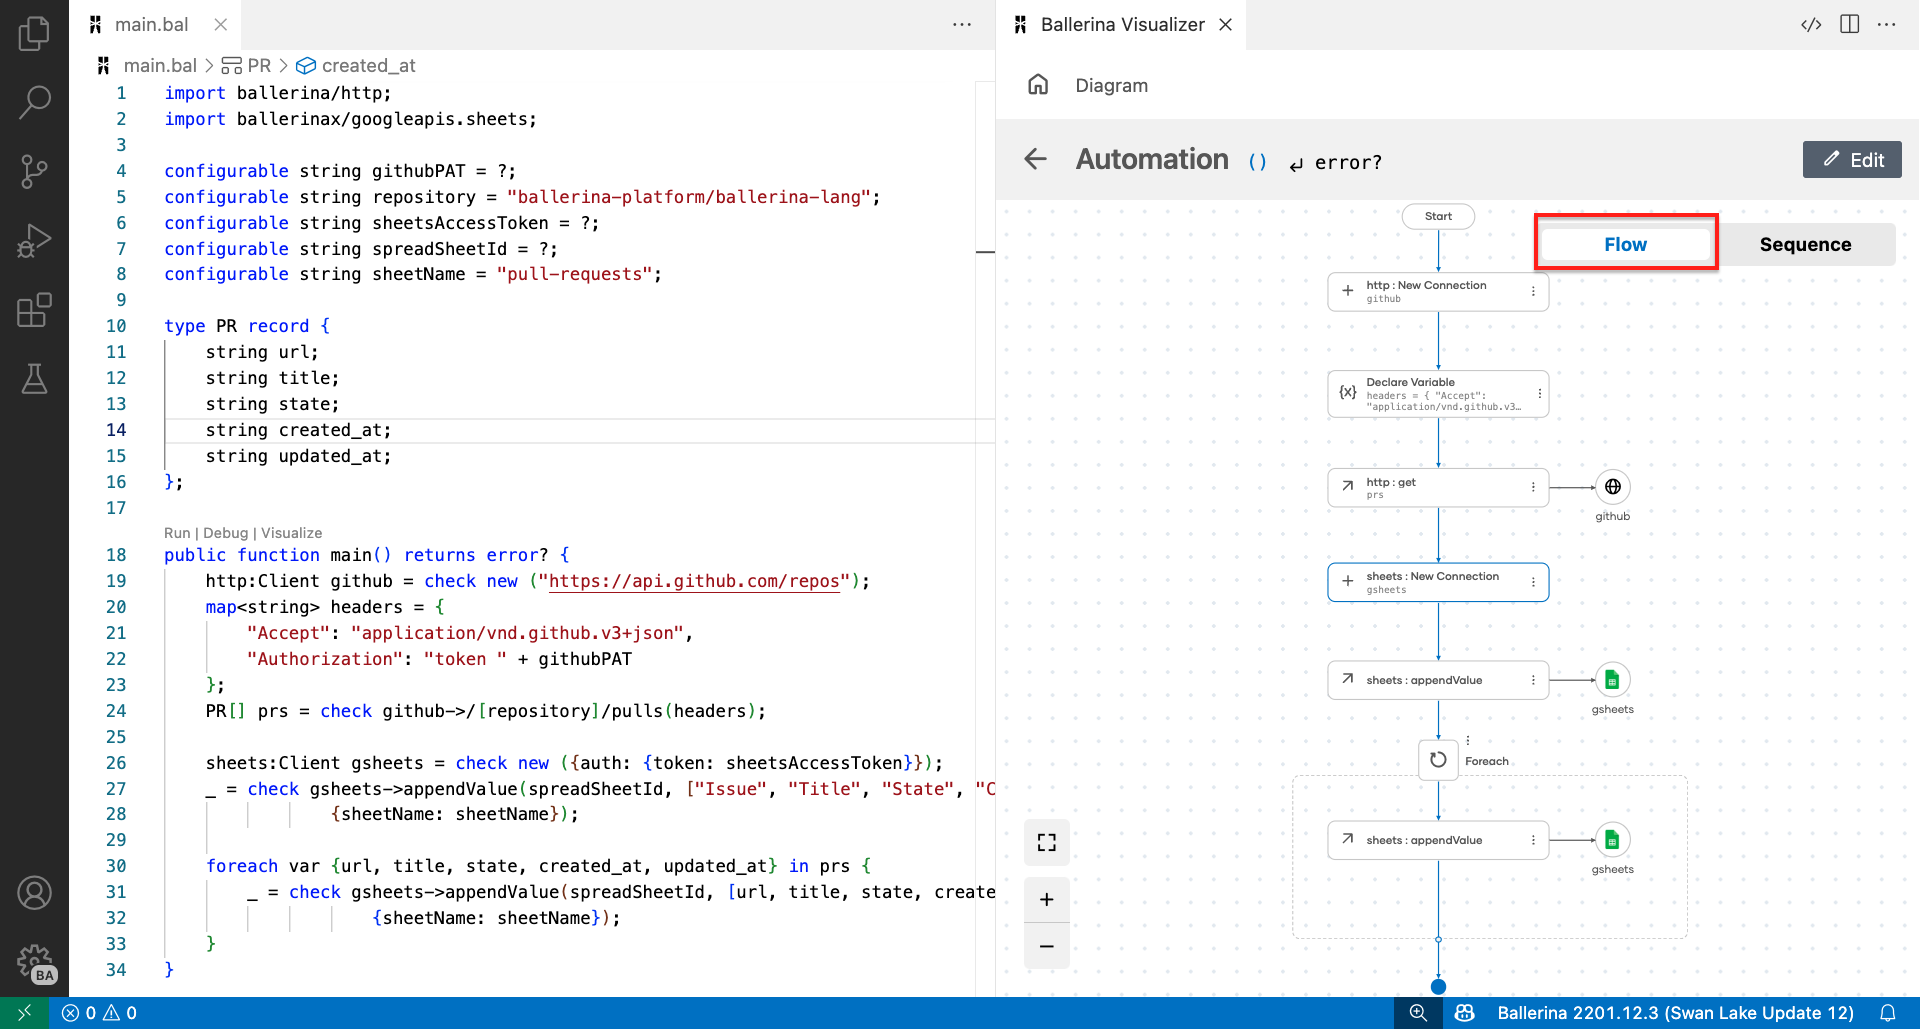
Sequence daiagram or flow diagram
Graphical representations of functions can be viewed as sequence diagrams or flow diagrams. Each function has a lifeline with a start and end, and this lifeline represents the flow of the function logic. Ballerina specifies interactions with remote endpoints through its syntax. These interactions are presented graphically in the diagram view by giving each endpoint a lifeline.
Source code
import ballerina/http; import ballerinax/googleapis.sheets; configurable string githubPAT = ?; configurable string repository = "ballerina-platform/ballerina-lang"; configurable string sheetsAccessToken = ?; configurable string spreadSheetId = ?; configurable string sheetName = "pull-requests"; type PR record { string url; string title; string state; string created_at; string updated_at; }; public function main() returns error? { http:Client github = check new ("https://api.github.com/repos"); map<string> headers = { "Accept": "application/vnd.github.v3+json", "Authorization": "token " + githubPAT }; PR[] prs = check github->/[repository]/pulls(headers); sheets:Client gsheets = check new ({auth: {token: sheetsAccessToken}}); _ = check gsheets->appendValue(spreadSheetId, ["Issue", "Title", "State", "Created At", "Updated At"], {sheetName: sheetName}); foreach var {url, title, state, created_at, updated_at} in prs { _ = check gsheets->appendValue(spreadSheetId, [url, title, state, created_at, updated_at], {sheetName: sheetName}); } }
Graphical view - Sequence diagram
Graphical view - Flow diagram
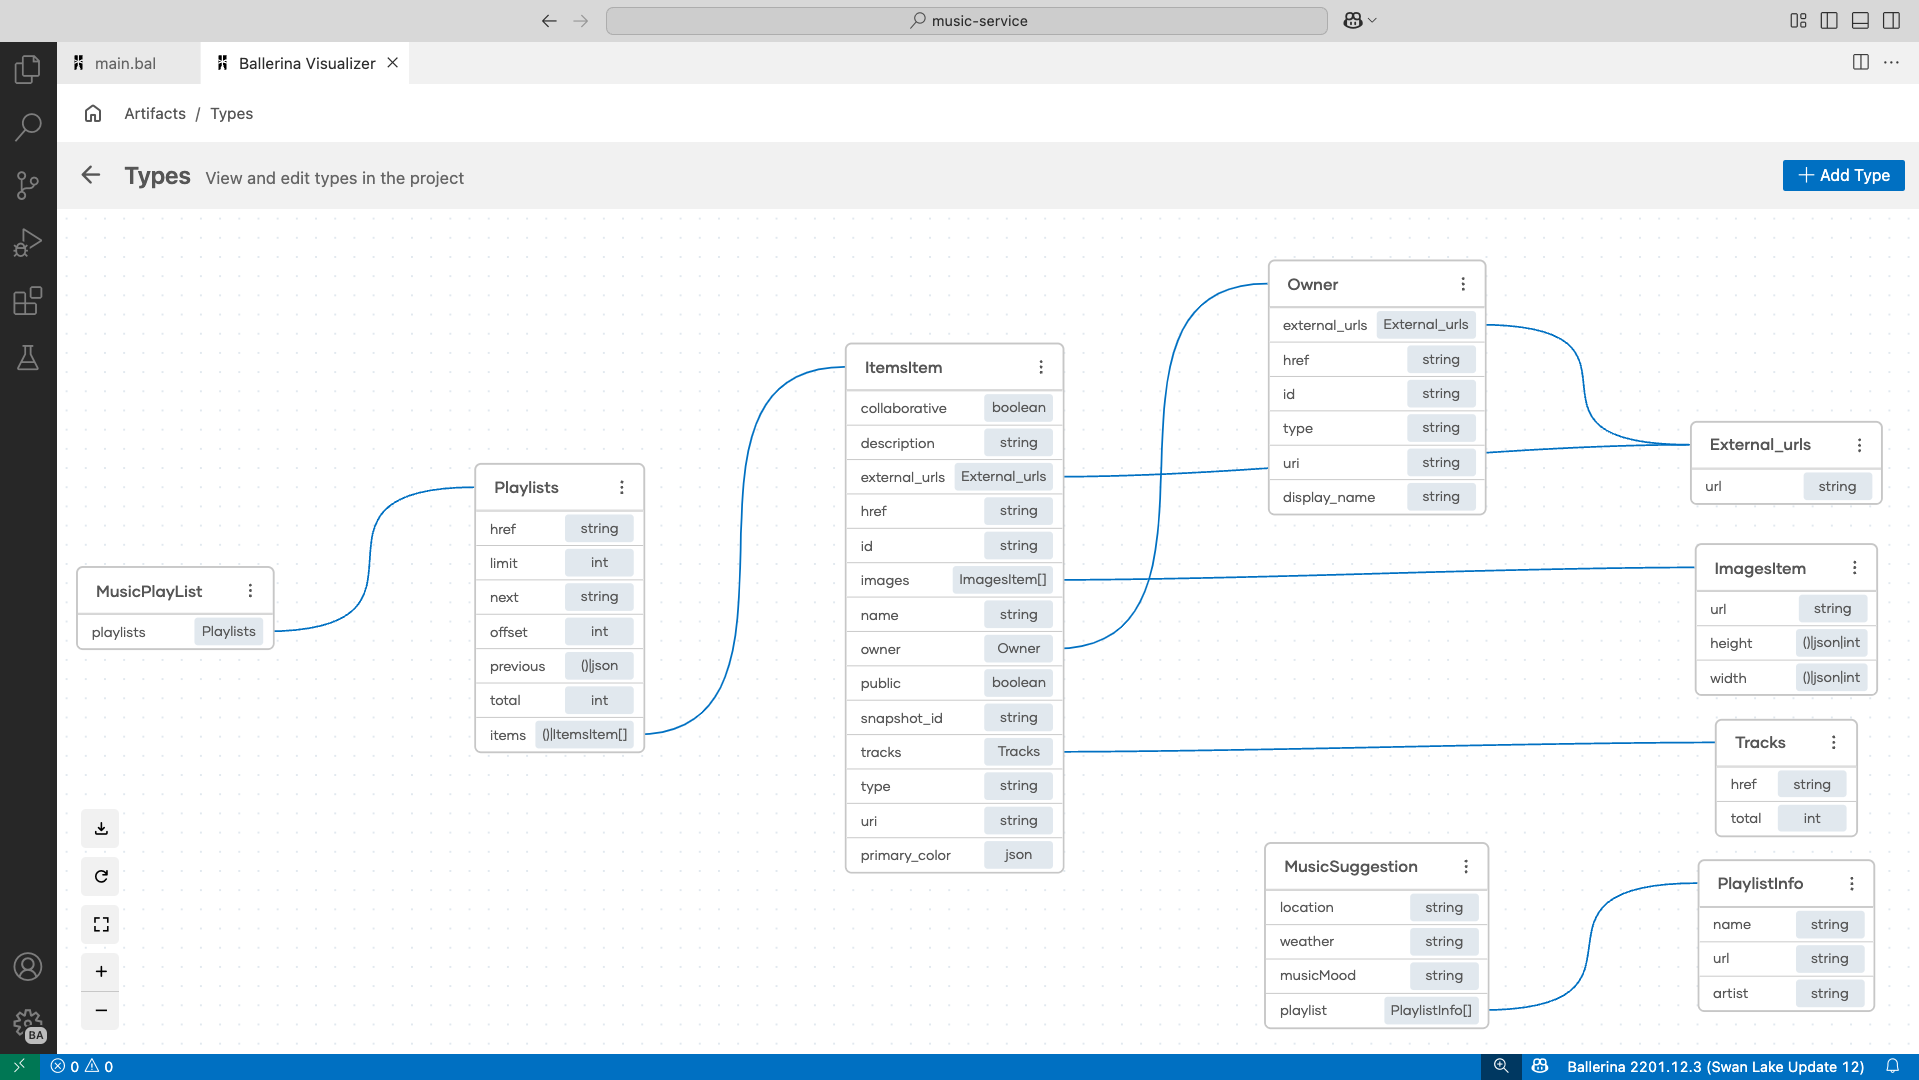
Type diagram
The Type Diagram shows a clear visual of how types are defined and connected in the application. It makes it easier to design data models and understand nested structures by showing their relationships graphically.
Source code
ype External_urls record {| string url; }; ype ImagesItem record {| string url; int|json|() height; int|json|() width; }; ype Owner record {| External_urls external_urls; string href; string id; string 'type; string uri; string display_name; }; ype Tracks record {| string href; int total; }; ype ItemsItem record {| boolean collaborative; string description; External_urls external_urls; string href; string id; ImagesItem[] images; string name; Owner owner; boolean 'public; string snapshot_id; Tracks tracks; string 'type; string uri; json primary_color; }; ype Playlists record { string href; int 'limit; string next; int offset; json? previous; int total; ItemsItem?[] items; ; ype MusicPlayList record {| Playlists playlists; }; ype PlaylistInfo record {| string name; string url; string artist; }; ype MusicSuggestion record {| string location; string weather; string musicMood; PlaylistInfo[] playlist; };
Graphical view - Type diagram
Develop programs in graphical mode
You can interact with the diagram through its nodes and lines. It allows you to edit or delete existing nodes, as well as add new nodes. When you hover over a line, you can add comments, insert new nodes by selecting from the panel, or use a prompt to generate the next set of nodes.